FIG 4.
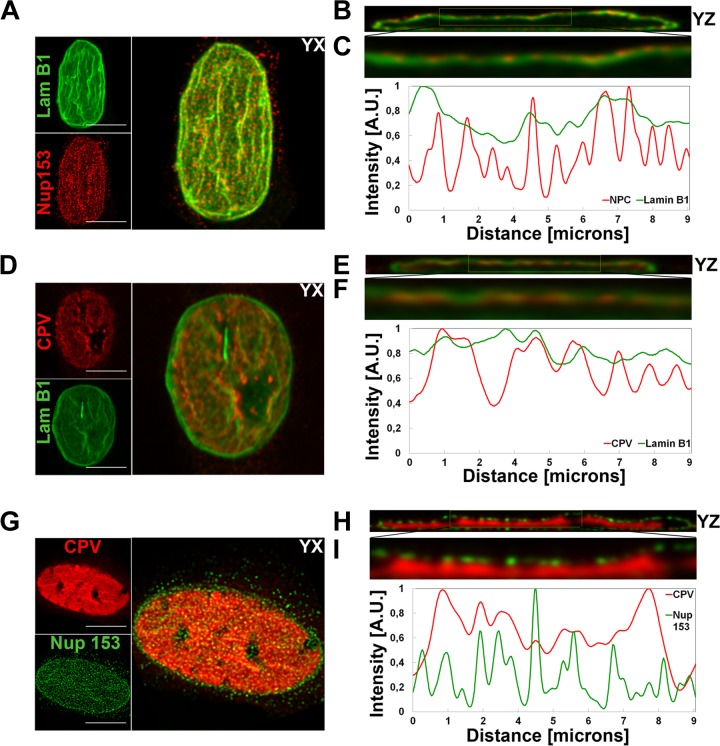
Intranuclear localization of lamin B1, NPCs, and viral capsids. Confocal microscopy-derived apical maximum-intensity projections are visualized with yz cross sections showing intranuclear distribution of NPCs (red) and lamin B1 (green) (A and B), virus capsids (red) and lamin B1 (green) (D and F), and virus capsids (red) and NPCs (green) (G and H). Capsids, NPC, and lamin B1 were visualized with capsid protein, Nup153, and lamin B1 antibodies. (C, F, and I) Normalized correlative intensity profiles from yz cross-section closeups are shown. Results of fluorescence line profile analysis of the intensity of capsids (red), NPCs (red/green), and lamin B1 (green) in a single optical section through the center of each nucleus are shown beside each image. Analysis was performed with ImageJ and the Plot RGB Profile plugin. A.U., arbitrary units. Bars, 10 μm.

