Figure 2.
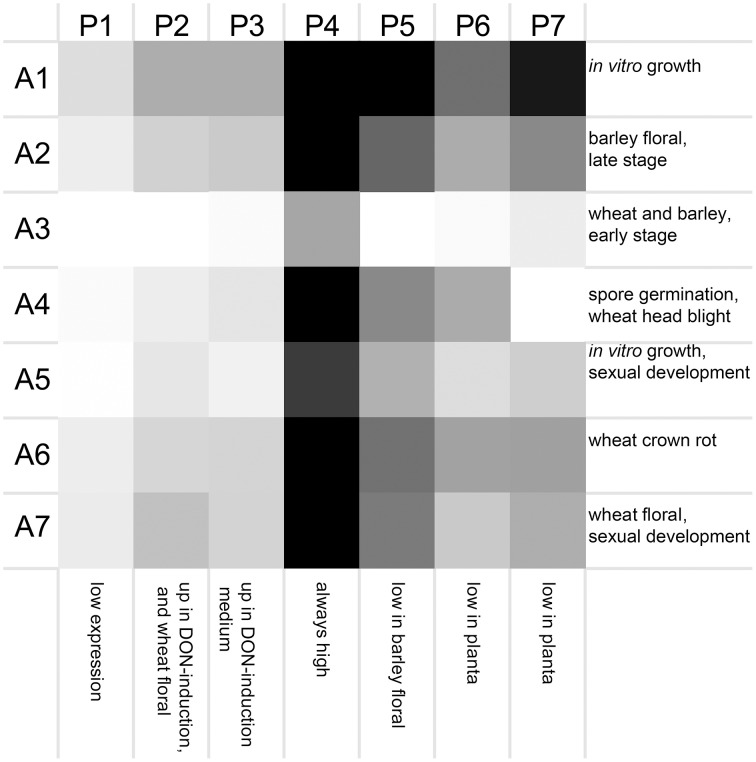
Averaged gene expression profiles for seven clusters of peptidases. Average values for peptidase (P1–P7) and microarray (A1–A7) clusters are plotted as a heat map (black, high expression; white, low expression). Characteristic treatments used in each array cluster are listed for each row, and characteristics of each peptidase expression profile are listed for each column.

