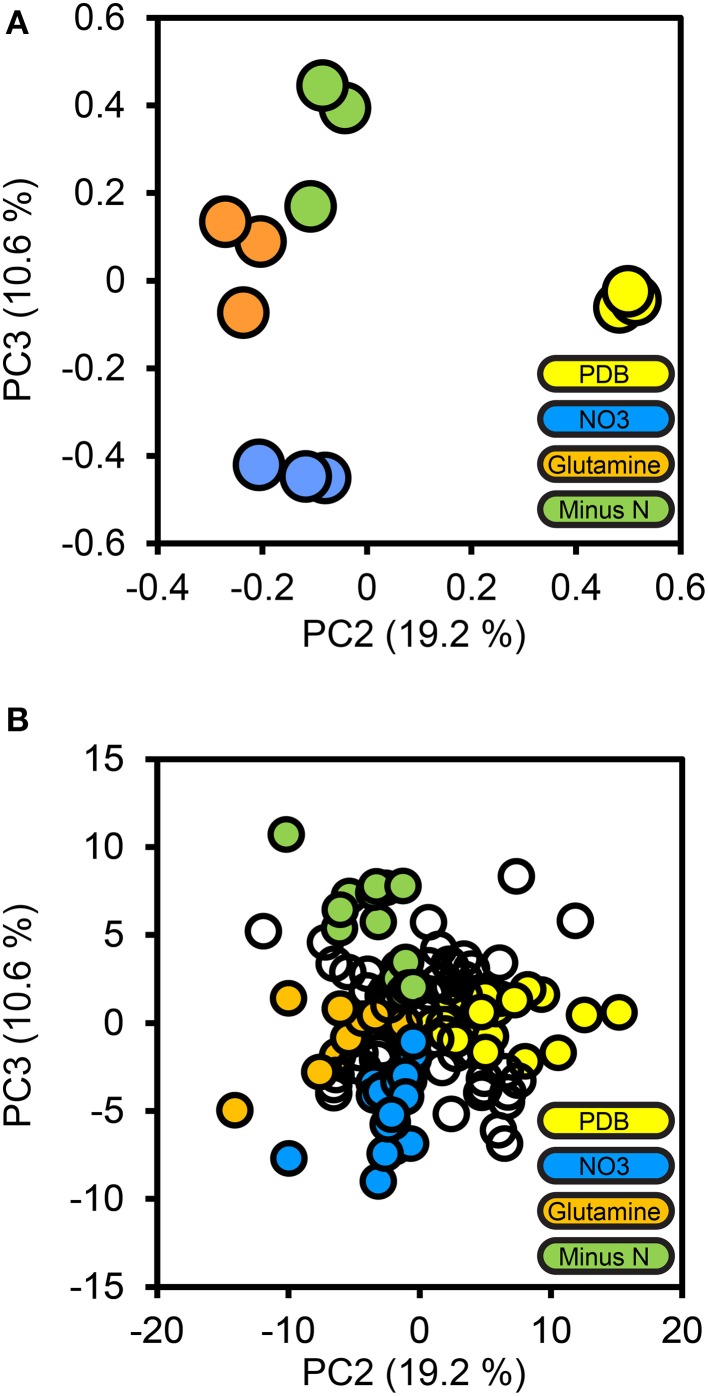
Figure 4.
Principal components analysis of the high confidence secretome. Protein LFQ abundances for the 134 protein high confidence secretome subset were subjected to principal components analysis. The PCA scores plot for PC2 and PC3 are shown in (A), with one marker drawn per biological replicate. The percentage of the total variance explained by each principal component is shown in brackets on each axis. Individual protein loadings for PC2 and PC3 are shown in (B), with one marker per protein, proteins we considered to be most influential for each treatment medium are colored according to that medium, the remainder are drawn as empty markers.

