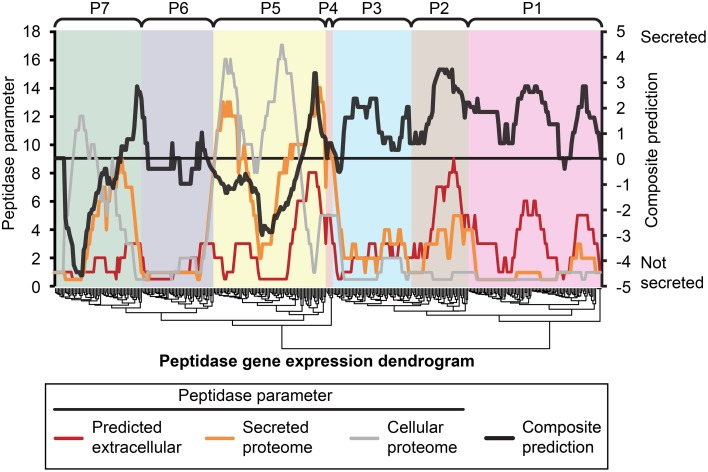
Figure 5.
Composite analysis of peptidase secretion and in planta expression. Peptidase secretion parameters were calculated for each peptidase shown in Figure 1. Peptidases are ordered by their gene expression profile, as in Figure 1. The peptidase frequency for three peptidase parameters, (1) bioinformatic prediction of secretion “Predicted extracellular,” (2) presence in the “Secreted proteome,” and (3) presence in the “Cellular proteome” was plotted on the leftmost Y-axis axis as a moving window (window size = 16), for example, if the value is 10, that means 10 out of 16 peptidases in the window were predicted to be secreted based on sequence characters. The right-most Y-axis shows the resultant “Composite prediction” of secretion (black trace), Composite prediction was calculated as Log2[mean[(1),(2)]/(3)], where a positive result indicates more likely secretion, a negative result less likely secretion. The gene expression clusters of peptidases determined in Figure 1 are shown above the plot.

