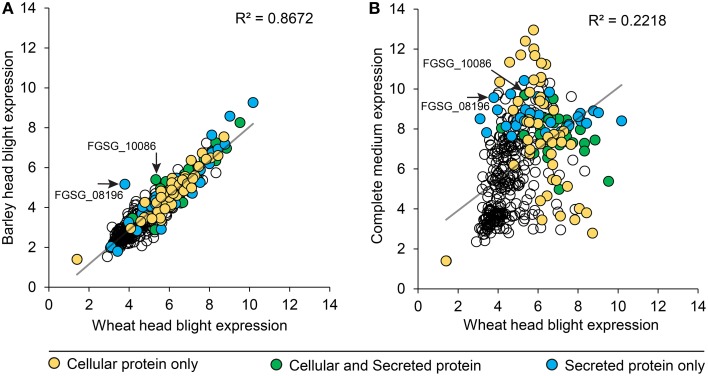
Figure 6.
Peptidase gene expression in wheat, barley and complete medium. F. graminearum peptidase gene expression (RMA values) from microarrays of barley and wheat head blight disease (A) were plotted to reveal the degree of transcriptional gene co-regulation on the two different host plants. Two peptidases that were differentially reguated between the two in planta conditions are indicated with an arrow and label. For comparison, gene expression (RMA values) from in vitro growth on complete medium were compared to wheat head blight (B). The secretion status determined from proteomics analyses is displayed in the shading of each peptidase value: yellow for cellular proteins, green for proteins found in both the cellular and secreted proteomes, and blue for proteins only found in the secreted proteome.

