
FIGURE 2.
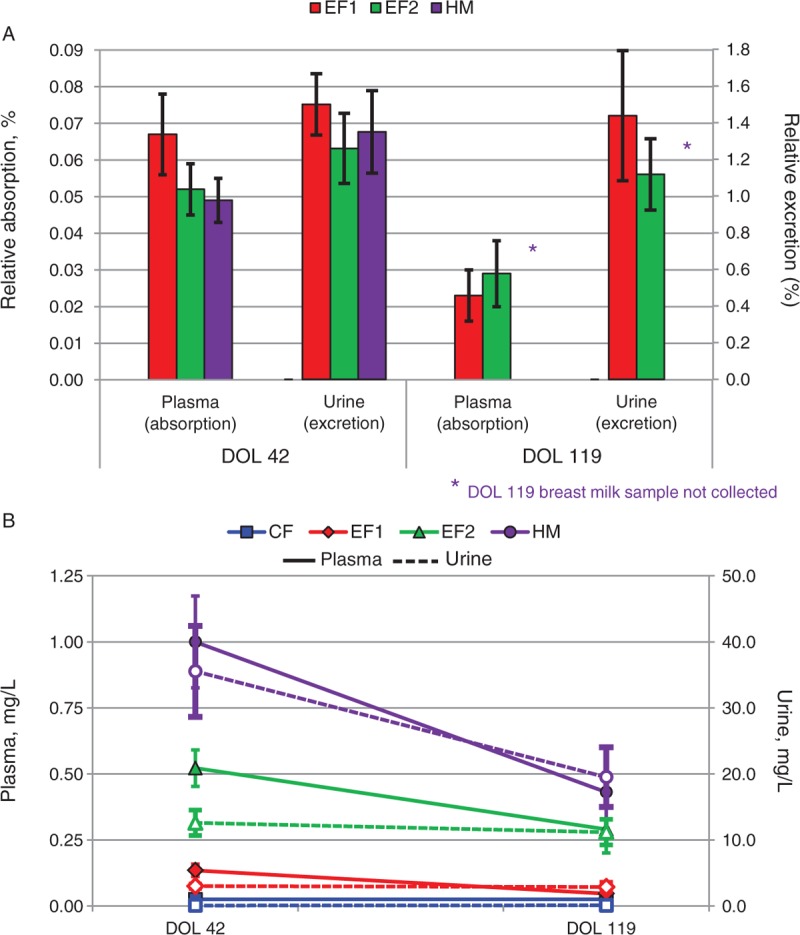
A and B, The relative absorption and excretion of 2′FL at DOL 42 and 119 (A) and the levels of 2′FL in plasma (solid line) and urine (dotted line) at DOL 42 and 119 (B). 2′FL = 2′-fucosyllactose; CF = control formula; DOL = day of life; EF = experimental formula; HM = human milk.