
FIG. 6.
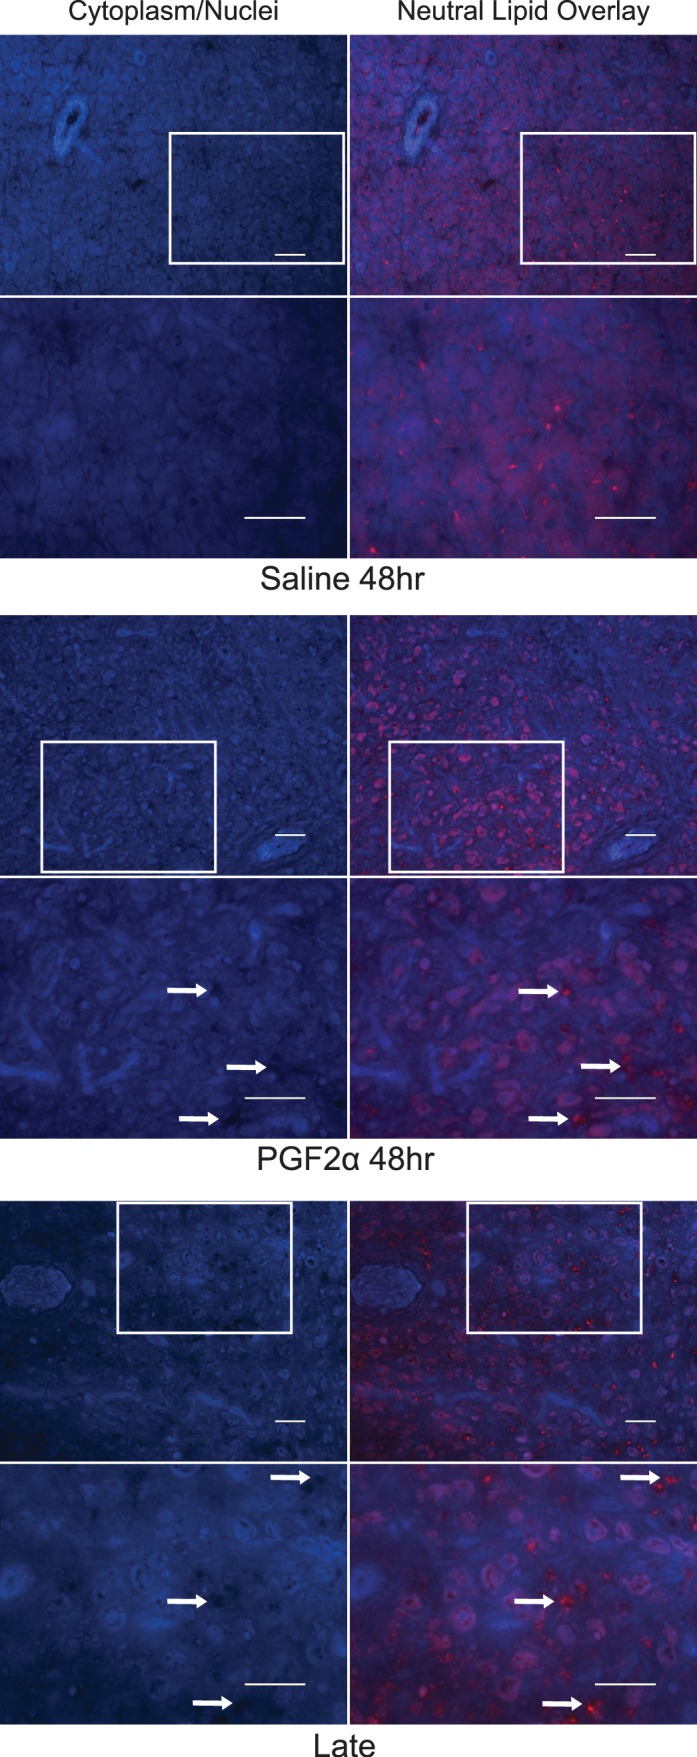
Qualitative changes in neutral lipid distribution in ovine luteal tissue during luteolysis. For each treatment, the left column shows cytoplasmic and nuclear staining to provide a view of the tissue structure, while the right column overlays neutral lipid staining. Bars = 50 μm. The boxes in the top row outline the approximate region that is shown at a higher magnification (×400) in the bottom row. Arrows in the PGF2α-treated and late luteal phase CL designate some of the potential extracellular regions that contain neutral lipid deposits.