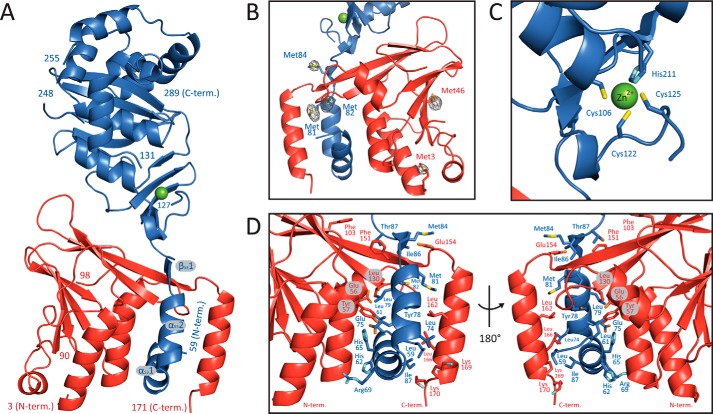
FIGURE 1.
Crystal structure of the pUL50-pUL53 complex. A, ribbon representation of the complex. pUL50 is shown in red, and pUL53 is in blue. The secondary structure elements of the hook-like N-terminal extension of pUL53 are designated as α531, α532, and β531. B, display of a portion of the phased anomalous difference electron density map that validates the location of the methionine residues in the final model. The map is displayed at a 5 σ cut-off and is calculated with the anomalous differences observed in the Se-Met peak dataset (Table 1). C, close-up view of the zinc-binding site. D, detailed representation of the interaction of the hook-like extension of pUL53 with pUL50 shown in two different orientations. Residues displayed in a stick representation contribute in excess of 50 Å2 of their surface area to the interaction.

