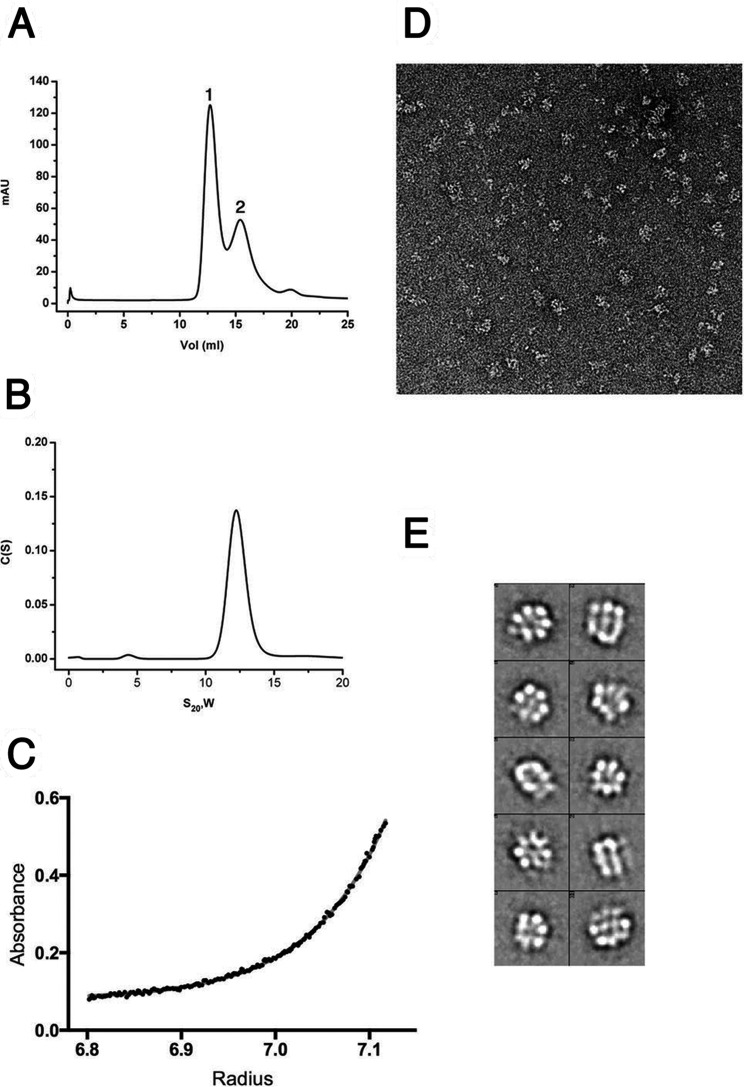
FIGURE 5.
Solution studies of Rep68-AAVS1 complex. A, size exclusion chromatography profile of the Rep68-AAVS1 complex. The DNA site used is a 41-mer DNA shown in Fig. 1B. The profile shows two peaks with the faster eluting peak corresponding to the Rep68-DNA complex, and the second peak corresponding to the excess free-DNA. mAU, milliabsorbance units. B, purified complex was analyzed by sedimentation velocity using a fluorescein-labeled AAVS1 DNA. Data were collected at 492 nm, and data were analyzed using the program Sedfit. Estimated molecular weight corresponds to a heptameric complex. C, equilibrium sedimentation of Rep68-AAVS1 was carried out in the same conditions as B and was fitted as a single sedimenting species model. The distribution of the residuals of the fit is shown. D, EM image of negatively stained Rep68-AAVS1 complex. The rings are easily recognized in the raw images. E, representative two-dimensional averages showing the heptameric complex.

