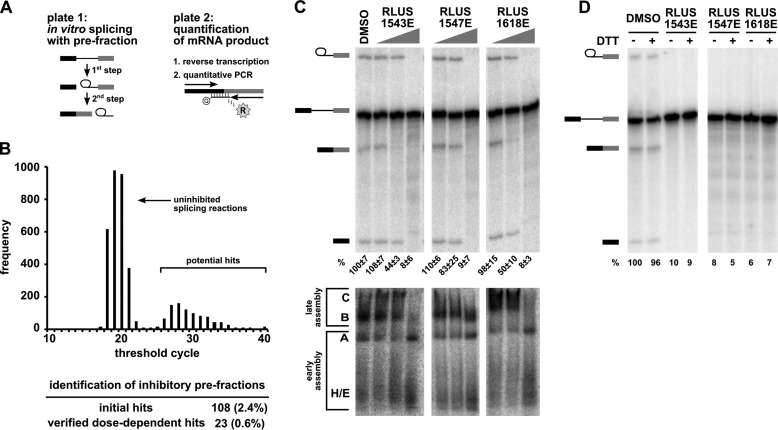
FIGURE 1.
High-throughput screening of a complex natural product library identified pre-fractions with splicing inhibitory activity. A, left panel: schematic of the two-step splicing reaction used to screen for inhibitors. Right panel: schematic of the RT-qPCR reaction used to measure the amount of spliced mRNA product. B, histogram shows the number of pre-fractions that yielded the indicated CT value in RT-qPCR analysis of in vitro splicing reactions. The table below summarizes the pre-fraction screening results. C, top panel: representative denaturing gel analysis of RNA isolated from 10-μl splicing reactions into which 1 μl of DMSO or the indicated pre-fractions at 0.04×, 0.2×, and 1× was included. Identities of the bands are schematized to the left as (from top to bottom) lariat-intermediate, pre-mRNA, mRNA, 5′exon intermediate. Average normalized splicing efficiency from triplicate splicing reactions is shown at the bottom of each lane. Bottom panel: native gel analysis of spliceosome assembly using the same reactions as in the top panel. Complex identity is indicated on the left, with complexes assembling in the following order: H/E → A → B → C. D, denaturing gel analysis of in vitro splicing reactions as described in C containing DMSO or indicated pre-fractions at 1× in both the presence (+) and absence (−) of 20 mm DTT. Bands are schematized as in C. Normalized splicing efficiency is shown at the bottom of each lane.

