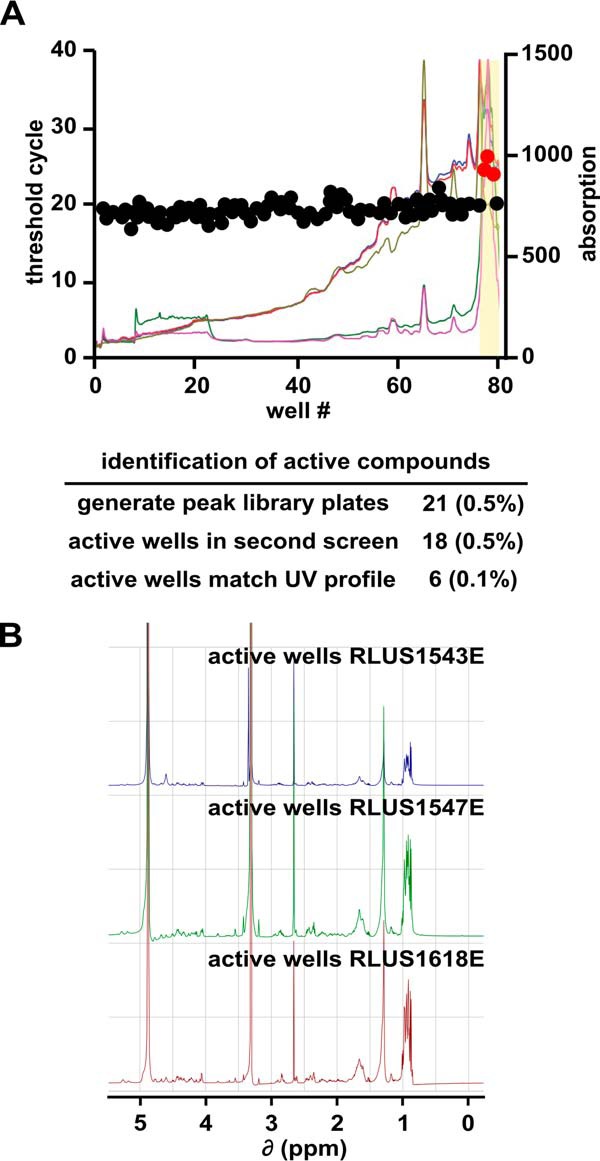
FIGURE 2.

Separation of active components from pre-fractions. A, well number plotted versus CT value (left axis) and UV-visual absorption spectra (right axis) for a representative peak-library plate. The active region of the peak-library is highlighted in yellow. The table below summarizes the screening results for all peak-libraries. B, NMR spectra of active peak-library wells derived from the indicated bacterial strains.
