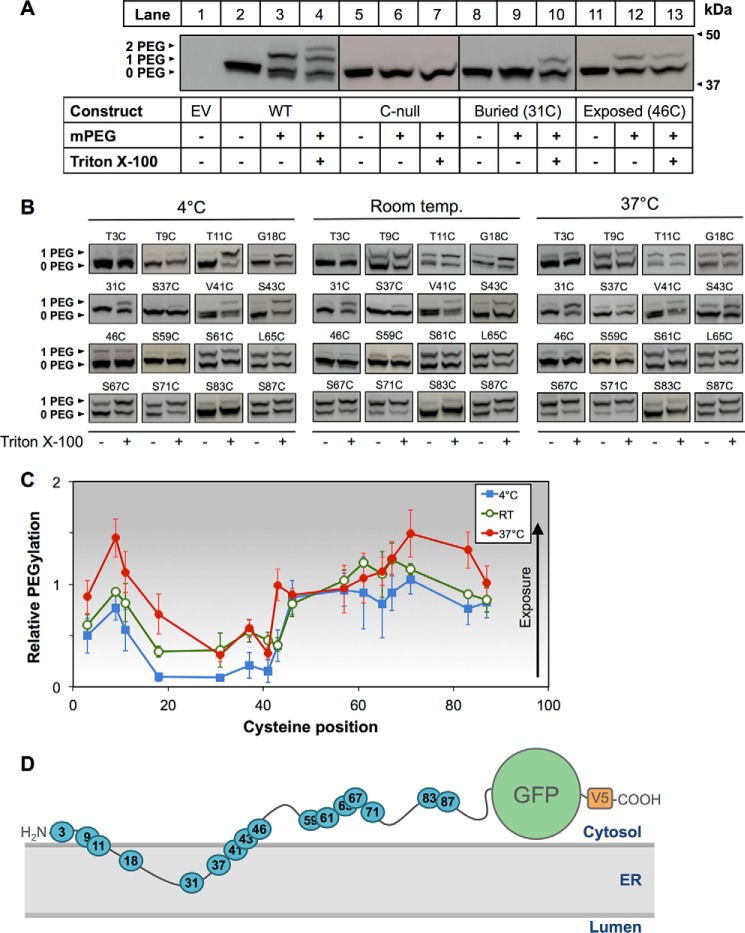
FIGURE 4.
Determination of SM N100 membrane topology using PEGylation assays. A, CHO-7 cells were transfected with the indicated constructs for 24 h, and then microsomal membranes were harvested. Microsomal proteins were treated with or without mPEG (5 mm) or Triton X-100 (1%, v/v) for 40 min at room temperature and quenched with DTT (10 mm) for 10 min at room temperature, and then proteins were separated by 12% SDS-PAGE. Membranes were immunoblotted with anti-V5 antibody. UnPEGylated protein is indicated by 0 PEG, singly PEGylated protein is indicated by 1 PEG, and doubly PEGylated protein is indicated by 2 PEG. Data are representative of n ≥ 3 taken from separate blots as indicated by separating lines. B, representative immunoblotting data for PEGylation of the indicated cysteine mutants at 4 °C, room temperature (denoted as Room temp.), or 37 °C performed as in A. C, average densitometries for the PEGylated bands of the indicated cysteine mutants at 4 °C, room temperature (denoted as RT), or 37 °C showing PEGylation relative to the Triton X-100-treated condition, which is set to 1. The increasing background gradient represents an increasing level of cytosolic exposure as indicated by the arrow. Data are presented as mean ± S.E. (error bars) from n ≥ 3 experiments. D, working model of SM N100-GFP-V5 based on densitometry values from C.

