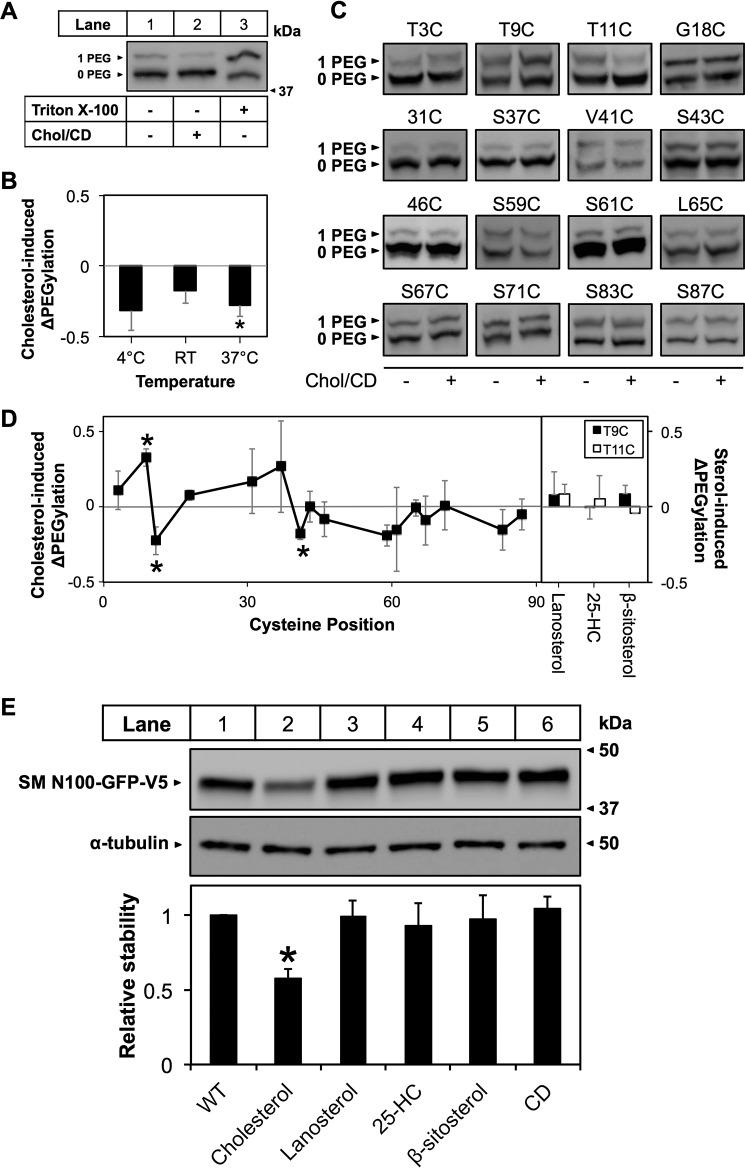
FIGURE 7.
Cholesterol induces a conformational change in SM N100. CHO-7 cells were transfected with the indicated constructs for 24 h, and then microsomal membranes were harvested. Microsomes were treated with or without cholesterol (Chol·CD; 20 μg of cholesterol/ml) for 30 min at room temperature. Excess cholesterol was removed by centrifugation prior to PEGylation. A, example blot for T11C. B, average densitometry values for T11C PEGylated at 4 °C, room temperature (denoted as RT), or 37 °C after cholesterol treatment. Values were normalized to the non-cholesterol-treated condition, which is set to 0. This line indicates no cholesterol-induced effect. Data are presented as mean ± S.E. (error bars) from n ≥ 3 experiments. C, representative immunoblotting data for PEGylation of the indicated cysteine mutants performed at 37 °C with or without cholesterol pretreatment. D, average densitometry values for PEGylation of Chol·CD-treated (20 μg of cholesterol/ml) microsomes from the indicated single cysteine mutants PEGylated at 37 °C and additional PEGylation of mutants T9C and T11C pretreated with lanosterol·CD, 25-hydroxycholesterol·CD (denoted 25-HC), or β-sitosterol·CD (20 μg of sterol/ml). Values were normalized as in B. *, values significantly different from PEGylation without prior cholesterol treatment (p < 0.05). Data are presented as mean ± S.E. (error bars) from n ≥ 3 experiments. E, representative immunoblot and average densitometry values for sterol treatments. CHO-7 cells were transiently transfected with SM N100-GFP for 24 h. Cells were pretreated overnight with compactin (5 μm) and mevalonate (50 μm) and then treated with the indicated sterols (20 μg of sterol/ml) for 8 h with compactin and mevalonate. Protein was harvested, separated by 10% SDS-PAGE, and then immunoblotted with anti-V5 using α-tubulin as a loading control. *, values significantly different from the untreated control (WT) (p < 0.001). Data are presented as mean ± S.E. (error bars) from n ≥ 3 experiments.

