
FIGURE 6.
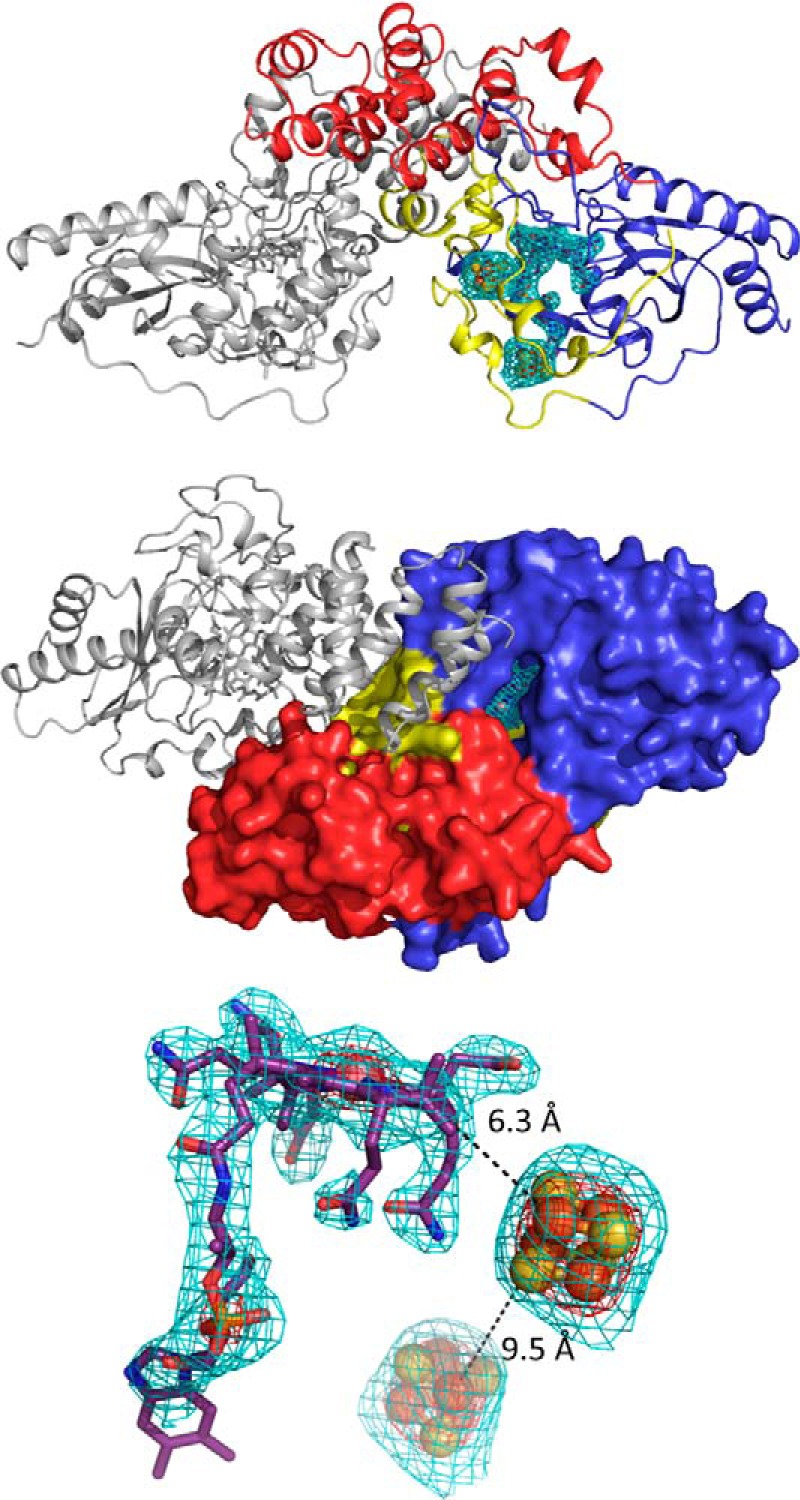
QueG crystal structure. A, schematic representation of a QueG monomer color coded as follows: N-terminal cobalamin binding region in blue, ferredoxin in yellow, and the C-terminal domain specific to QueG in red. The cofactors are shown in atom colored sticks with the corresponding FoFc omit map contoured at 3 sigma shown as a cyan mesh. B, solvent accessible surface of a QueG monomer color coded as in panel A. The bound cobalamin resides at the bottom of a deep solvent accessible cavity. The QueG orientation is related to that in panel A by a 90-degree rotation along the horizontal axis. A second QueG monomer is shown in gray schematic depiction illustrating the putative dimeric form observed in the crystal structure. C, detailed view of the three cofactors bound to QueG with the corresponding FoFc omit map contoured at 3 and 10 sigma, shown as a cyan and red mesh, respectively. Black dotted lines indicate the closest Fe-Fe distance and the closest Fe to corrin distance.