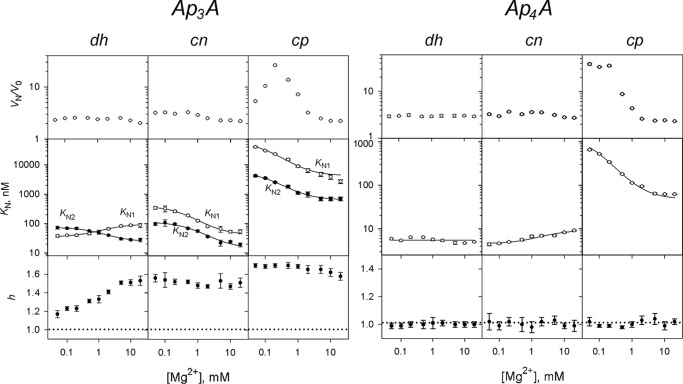
FIGURE 2.
Mg2+ concentration dependence of CBS-PPase activation by Ap3A (left panel) and Ap4A (right panel). The panels show (from top to bottom) the activation factor KN1 (○) and KN2 (●) values and Hill coefficients. The KN1 and KN2 lines show the best fits to Equation 3. The horizontal dotted lines (h = 1) mark the boundary between positive and negative cooperativity. dh, dhPPase; cn, cnPPase; cp, cpPPase.

