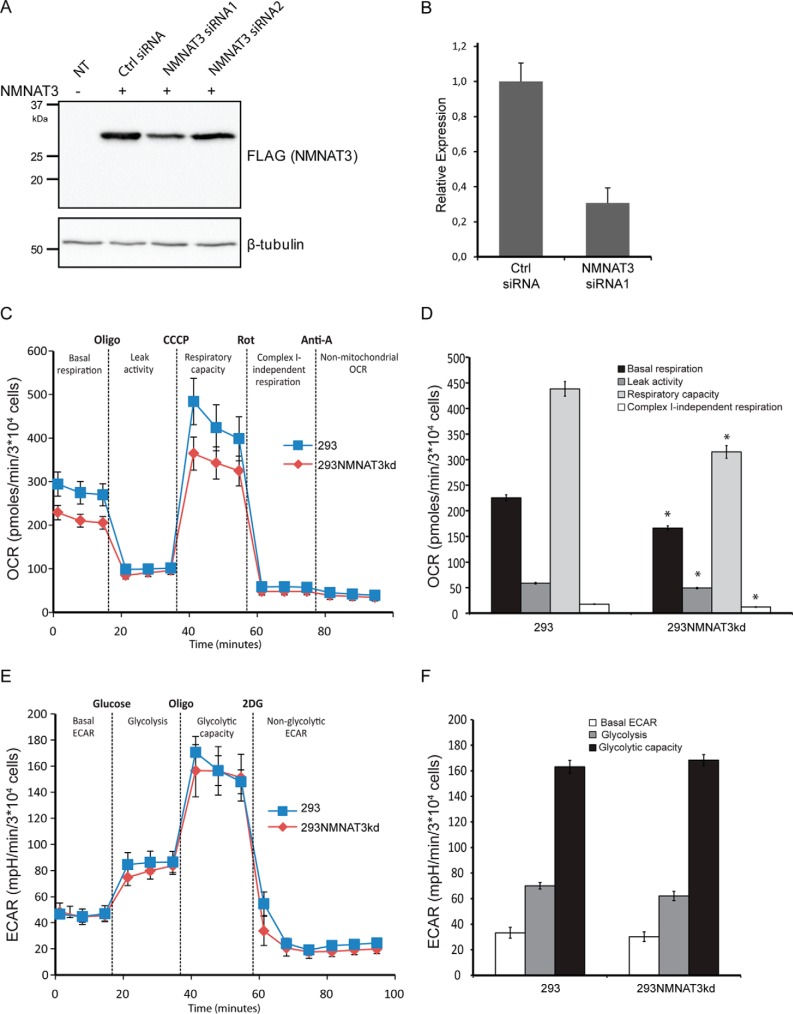
FIGURE 10.
Down-regulation of NMNAT3 gene expression in 293 cells reduces mitochondrial respiration. A, FLAG immunoblot analysis of 293 cell lysates prepared after 24 h of expression of plasmid encoding C-terminally FLAG-tagged NMNAT3 in the presence of two distinct NMNAT3 siRNAs and control siRNA. NT, lysates from untransfected 293 cells. B, relative NMNAT3 gene expression in 293 cells after 48 h of transfection of NMNAT3 siRNA1 and control siRNA (Ctrl) as revealed by QRT-PCR. The NMNAT3 transcript level was normalized to β-actin. C, mitochondrial respiration assessed by measuring OCR in 293 cells transfected with NMNAT3 siRNA1 (293NMNAT3kd) and control siRNA (293). D, quantification of the mitochondrial respiration data obtained in C. *, p < 0.05 E, glycolysis was analyzed by ECAR in 293 cells transfected with NMNAT3 siRNA1 (293NMNATkd) and control siRNA (293). F, quantification of the glycolysis data obtained in E.

