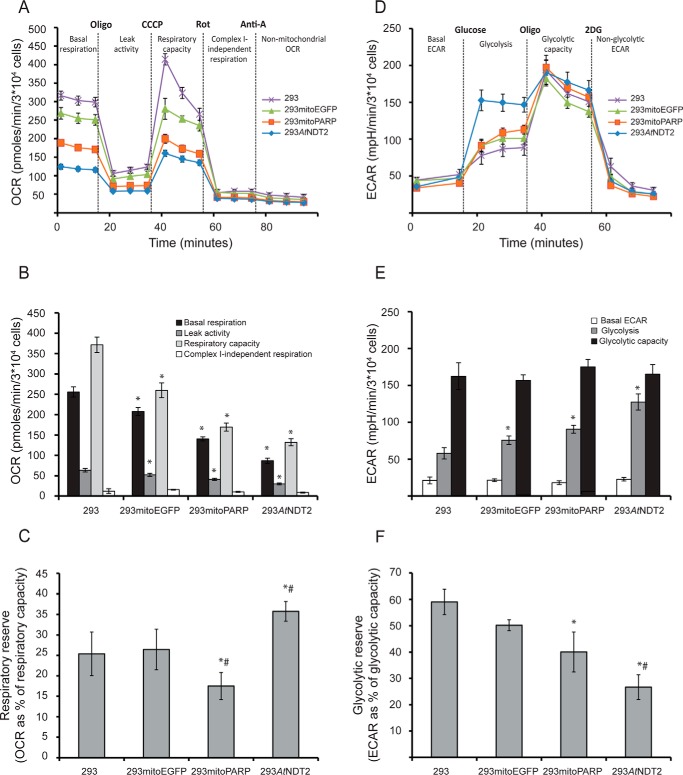
FIGURE 7.
Subcellular distribution of cellular NAD+ determines the metabolic fate of cells. The activity and integrity of glycolysis and mitochondrial respiration in 293AtNDT2 cells were determined by extracellular flux analysis and compared with parental 293 cells and 293 cells stably expressing mitochondrial EGFP (293mitoEGFP) or the mitoPARP construct (293mitoPARP). A, mitochondrial respiration was assessed by measuring OCR after sequential addition of oligomycin (Oligo, 3 μm), CCCP (0.5–1 μm), rotenone (Rot, 1 μm), and antimycin A (Anti-A, 1 μm). The figure shows representative data from one of four experiments. B, quantification of the mitochondrial respiration data obtained in A. The rate determined after the addition of antimycin A was subtracted as background. The results are shown as the averages of four independent experiments (means ± S.D.). *, p ≤ 0.001 versus 293. C, respiratory reserve capacity (respiratory capacity − basal respiration) calculated as percentages of respiratory capacity. The results are shown as averages from four independent experiments (means ± S.D.). *, p < 0.05 versus 293; #, p < 0.05 versus 293mitoEGFP. D, glycolysis was studied by analyzing ECAR after sequential additions of glucose (10 mm), oligomycin (Oligo, 3 μm), and 2-deoxyglucose (2DG, 100 mm). The figure shows representative data from one of four experiments. E, quantification of the glycolysis data obtained in C (means ± S.D.). The rate determined after addition of 2-deoxyglucose was subtracted as background. *, p ≤ 0.001 versus 293. F, the glycolytic reserve capacity (glycolytic capacity − basal glycolysis) was calculated as percentage of glycolytic capacity. The figure shows data (means ± S.D.) from three independent experiments. *, p < 0.05 versus 293; #, p < 0.05 versus mitoEGFP.

