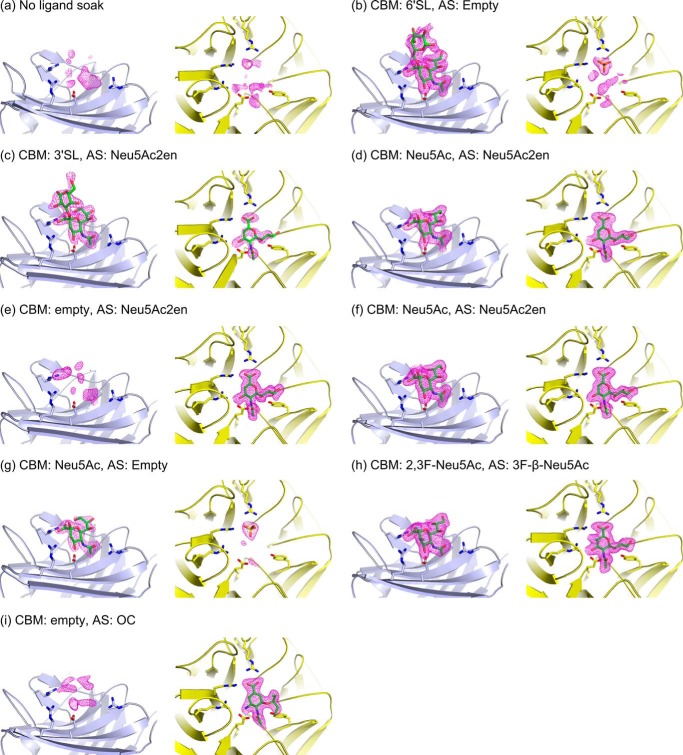
FIGURE 3.
Views of the CBM binding site (light blue) and catalytic domain active site (AS, yellow) for all described crystal structures. Bound ligands (green) are indicated for both sites. Soaking ligands were: none PDB code 4YZ1 (a), 6′SL PDB code 4YW2 (b), 3′SL (200 mm for 2 min) PDB code 4YZ5 (c), 3′SL (20 mm for 15 min) PDB code 4YW1 (d), Neu5Ac2en (50 mm for 2 min) PDB code 4YZ2 (e), Neu5Ac2en (20 mm for 45 min) PDB code 4YW3 (f), Neu5Ac PDB code 4YZ4 (g), 2,3F-Neu5Ac PDB code 4YW0 (h), and OC PDB code 4YW5 (i). The Fo − Fc omit map electron density is shown carved around the ligands and contoured at a level of 3 σ (magenta mesh). Panels a–i correspond to crystal structures a–i in Table 1.

