FIGURE 7.

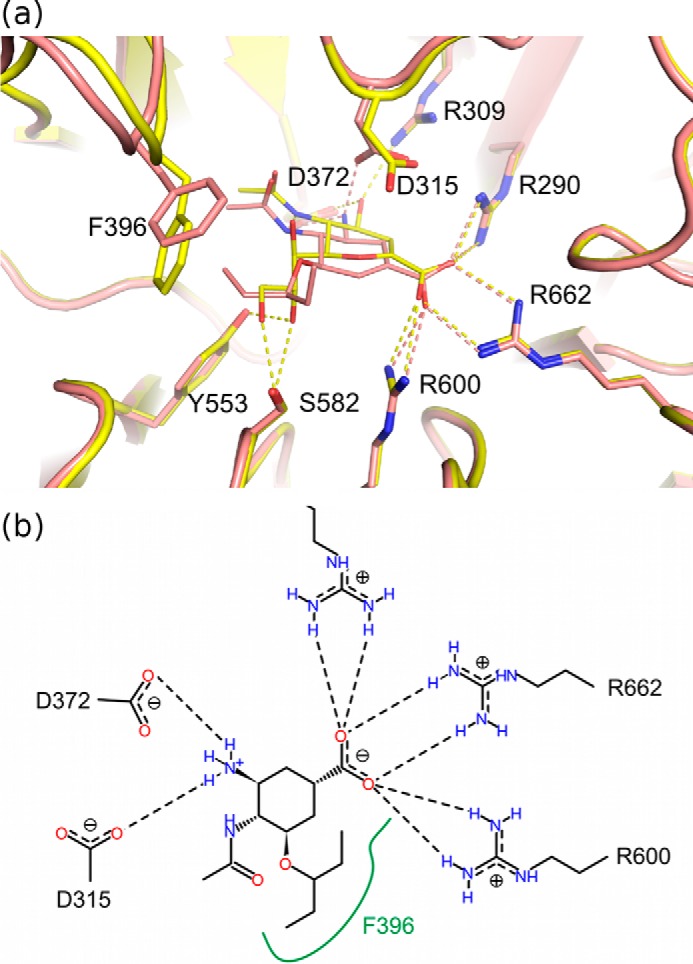
a, OC bound in the NanC active site (PDB code 4YW5, salmon) in comparison with Neu5Ac2en (PDB code 4YW3, yellow). The dashed lines in the corresponding color represent hydrogen-bonding interactions. b, a schematic representation of the interactions between OC and the NanC active site. The green line represents a hydrophobic surface.
