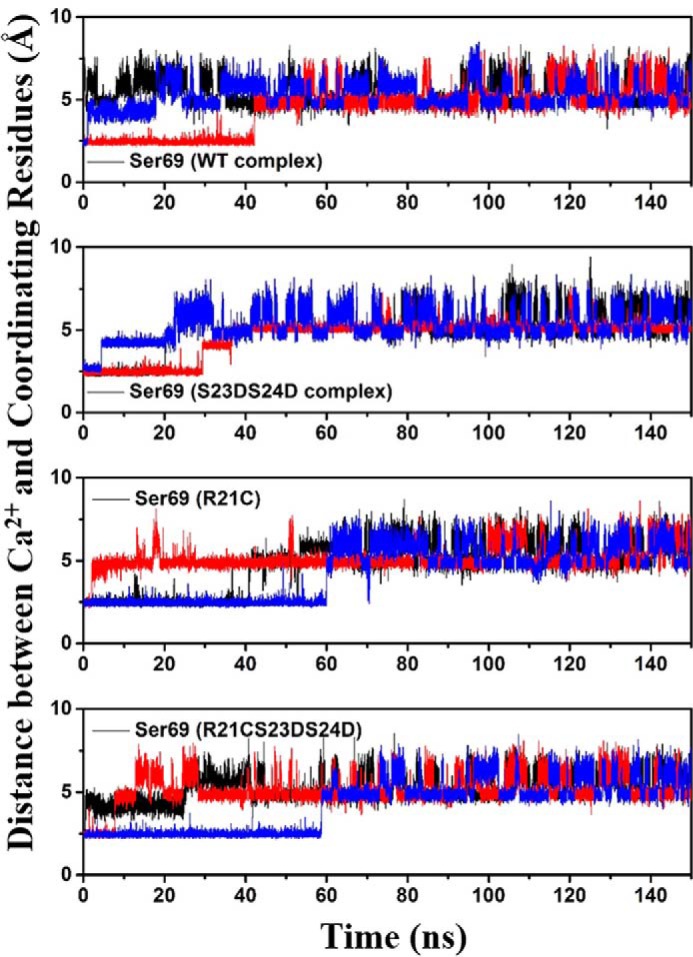
FIGURE 8.

Distances between Ca2+ and its coordinating residue Ser-69 of cTnC site II over the course of each MD simulation for four complexes. Here, the 1st run result is shown in black; the 2nd run result is in red, and the 3rd run result is in blue.
