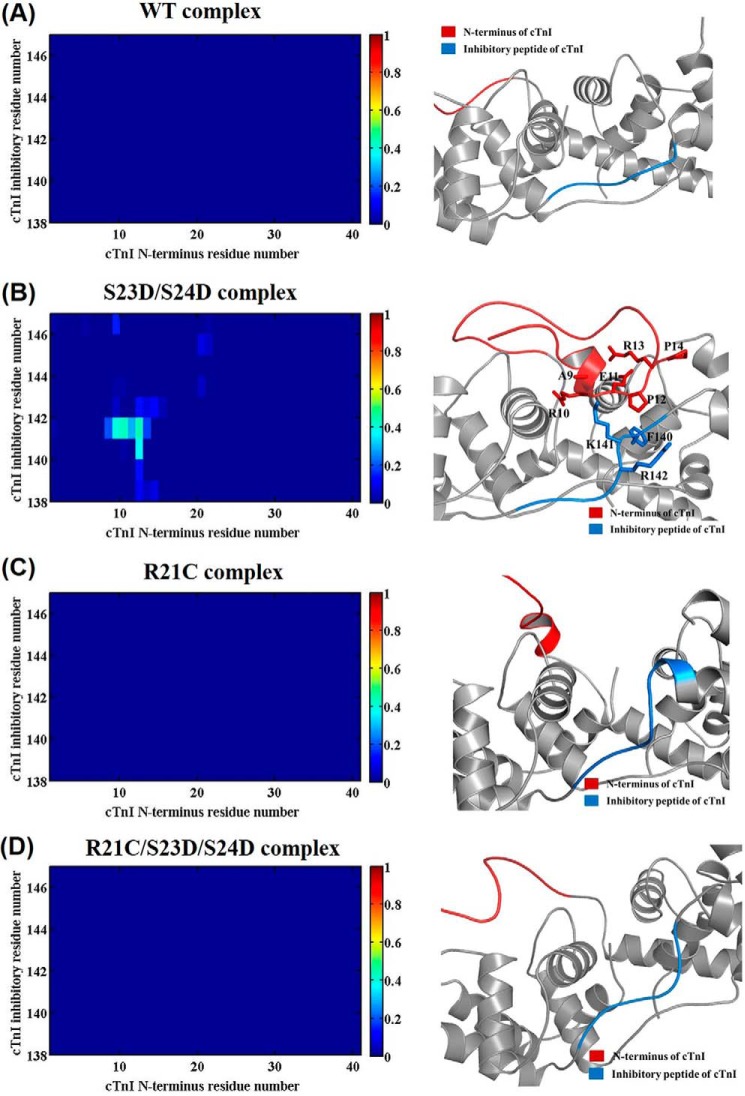
FIGURE 9.
Average contact map of residue-residue pairs (left) and the representative binding pattern (right) between the N terminus (shown in red) and inhibitory peptide region (shown in blue) of cTnI for the WT (A), cTnI-S23D/S24D (B), cTnI-R21C (C), and cTnI-R21C/S23D/S24D (D) cTn models. The blue end of the spectrum (value 0) reflects no contact between residue-residue pair, and the red end of the spectrum (value 1) represents 100% contact between residue-residue pair.

