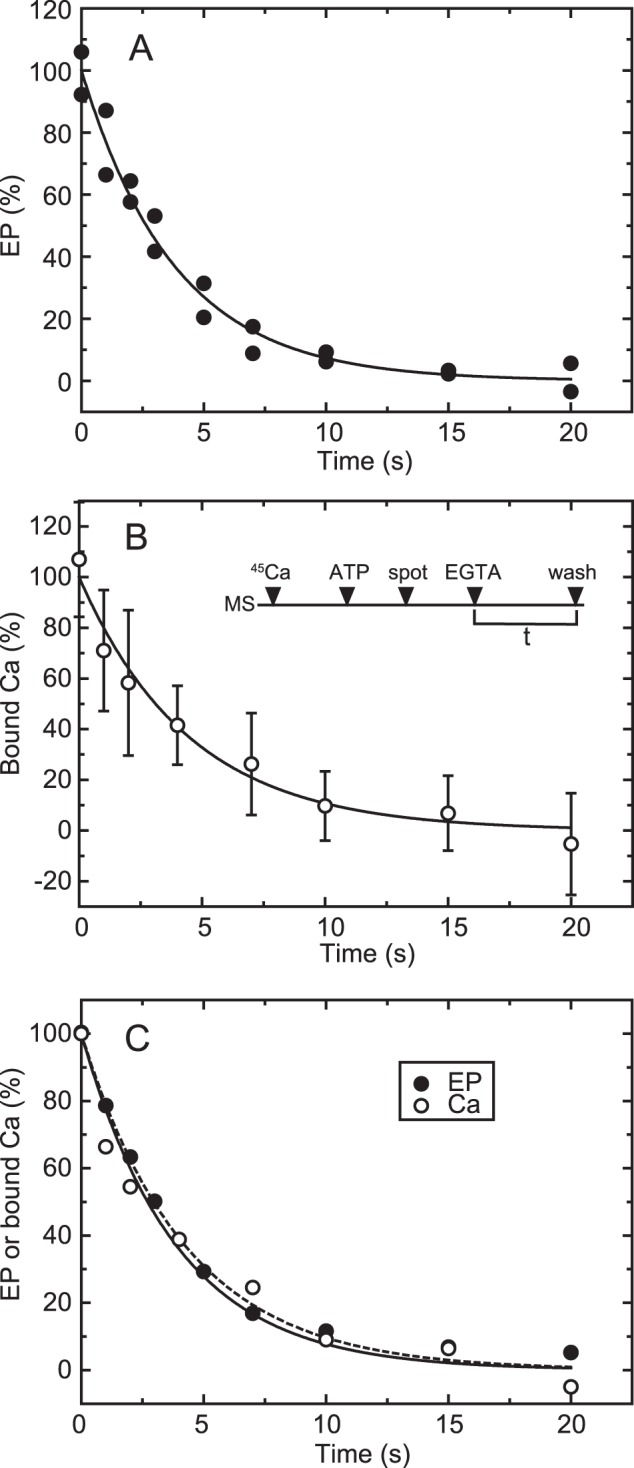
FIGURE 5.

Time courses of EP isomerization and Ca2+ release in the wild type. A, for the determination of EP, wild-type Ca2+-ATPase was phosphorylated in a mixture containing 20 μg/ml microsomal protein, 20 μm [γ-32P]ATP, 10 μm CaCl2, 50 mm MOPS/Tris (pH 7.3), 0.1 m KCl, 7 mm MgCl2, and 3 μm A23187. Then the phosphorylation was chased at zero time by mixing with an equal volume of EGTA chase solution containing 1 mm EGTA, 50 mm MOPS/Tris (pH 7.3), 0.1 m KCl, 7 mm MgCl2, and 3 μm A23187. The reaction was quenched by acid at the indicated times. Here it should be noted that nearly all the EP was E1P in the presence of KCl (actually more than 95%), as we observed under essentially the same conditions (cf. Fig. 2A in Ref. 42). Therefore, EP decay represents EP isomerization (which is followed by rapid E2P hydrolysis). B, for the Ca2+ binding assay, wild-type Ca2+-ATPase in microsomes (MS) was incubated for 5 s with 10 μm 45Ca2+ in 50 mm MOPS/Tris (pH 7.3), 0.1 m KCl, 7 mm MgCl2, and 3 μm A23187 and phosphorylated by addition of a small volume of ATP to give 10 μm (ATP) for 20 s. Immediately, the mixture (50 μl) was spotted on the membrane filter (spot), and, at zero time (EGTA), free Ca2+ was removed to initiate EP decay by continuous rinsing with the above EGTA chase solution. After various periods (t), the amount of 45Ca2+ specifically bound to Ca2+-ATPase was determined by washing the filter with 1 ml of the Ca2+ binding assay medium as in Fig. 4 (wash). The values presented are the mean ± S.D. (n = 3–6). C, the time courses of EP decay (closed circles) and decrease in bound 45Ca2+ (open circles) determined in A and B are replotted in the same panel. The plots show the mean values in A and B. The solid and broken lines show a single exponential fit in which the rates are 0.23 s−1 for EP decay and 0.22 s−1 for the decrease in bound 45Ca2+, respectively.
