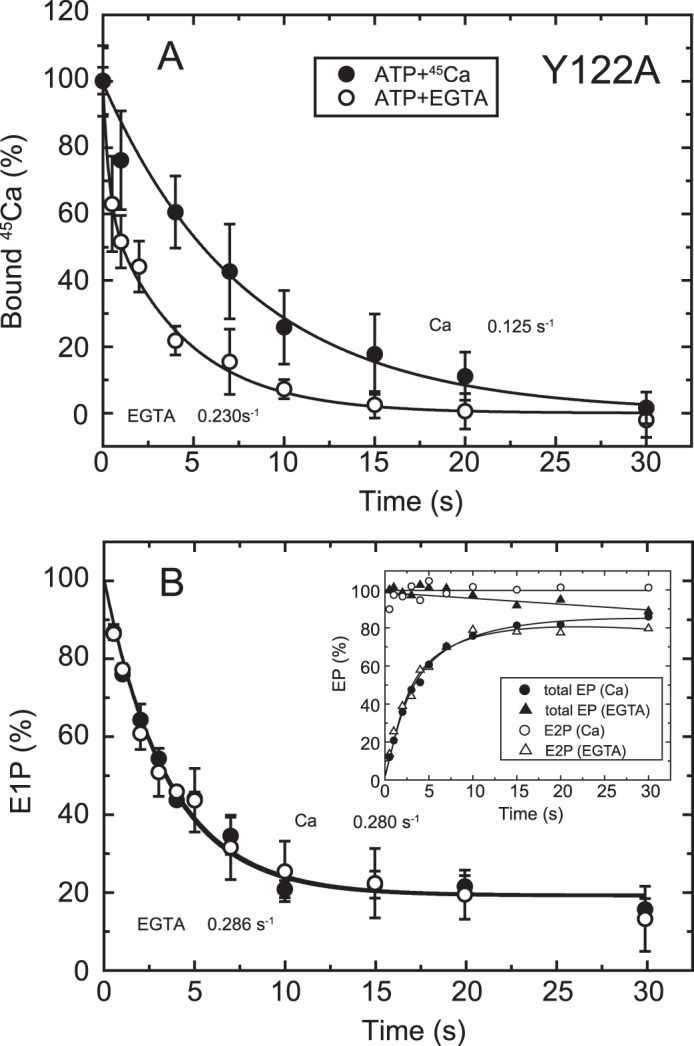
FIGURE 7.

Time courses of Ca2+ release and EP isomerization in mutant Y122A. A, Ca2+ release from EP in the mutant Y122A was determined as in Fig. 6A. The values presented are the mean ± S.D. (n = 3–5). The solid lines show a single exponential fit, and the rates of the 45Ca2+ release thus determined are 0.23 s−1 in an excess of EGTA (open circles) and 0.125 s−1 in the presence of 10 μm 45Ca2+ (closed circles). B, inset, the total amount of EP (closed symbols) and the amount of E2P (open symbols) were determined at the indicated times with the mutant Y122A as described in Fig. 6B. Main panel, the fraction of E1P in the total amount of EP was calculated at each time point by subtracting the amount E2P from the total amount of EP (E1P plus E2P). The solid lines show a single exponential fit, and the rates of the decrease in E1P fraction, i.e. the E1P to E2P isomerization, thus determined are 0.286 s−1 in an excess EGTA (open circles) and 0.280 s−1 in the presence of 10 μm Ca2+ (closed circles).
