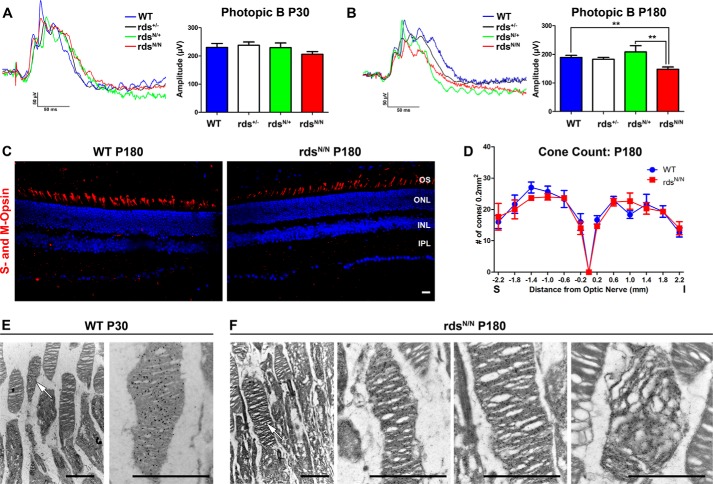
FIGURE 6.
Cone function is decreased at later time points in mice that lack RDS glycosylation without an associated loss of cone photoreceptor cells. A and B, cone photoreceptor function was analyzed using full-field photopic ERG at P30 (A) and P180 (B). **, p < 0.05 by one-way ANOVA with Bonferroni post hoc comparison. Shown are mean values from n = 4–16 mice/genotype. C, frozen retinal sections along the superior-inferior axis (S-I) were prepared from P180 WT and rdsN/N mice, and cones were labeled with a mixture of antibodies specific to M-opsin and S-opsin (red), with nuclei counterstained with DAPI. INL, inner nuclear layer; IPL, inner plexiform layer. D, starting at the optic nerve, total cones were counted in 200-μm2 areas at the indicated distances from the optic nerve. Shown are means (n = 3/genotype) ± S.E. E and F, retinal sections at P30 or P180 were immunogold-labeled with antibodies against S-opsin to identify cone OSs. Arrows indicate cone OSs in low-magnification EM images. The right panels show higher-magnification images of cone OSs. Most cone OSs in rdsN/N exhibit normal morphology, but abnormal cone OSs are also seen (far right panel, F). Scale bars = C, 50 μm; E and F, 2 μm.

