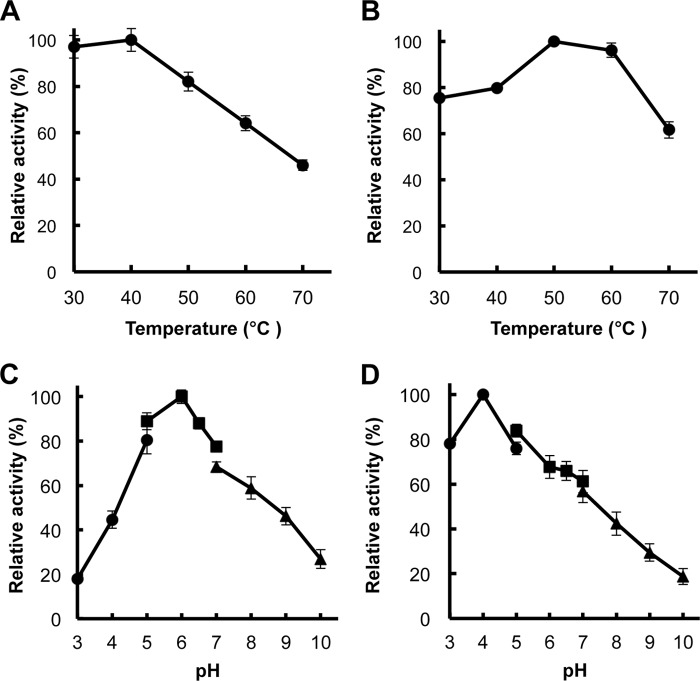
FIGURE 8.
Temperature and pH optima of rMan134A and rMan5C. A and B, optimal temperature of rMan134A (A) and rMan5C (B). Enzyme reactions proceeded at temperatures ranging from 30 °C to 70 °C for 15 min. C and D, optimal pH of rMan134A (C) and rMan5C (D). Enzyme reactions proceeded over pH range 3.0–10.0. Buffers were 50 mm sodium acetate (pH 3.0–5.0; ●), 50 mm sodium phosphate (pH 5.0- 7.0; ■), and 50 mm glycine-NaOH (pH 7.0–10.0; ▴). Error bars are shown as the means ± S.E. of three independent experiments.

