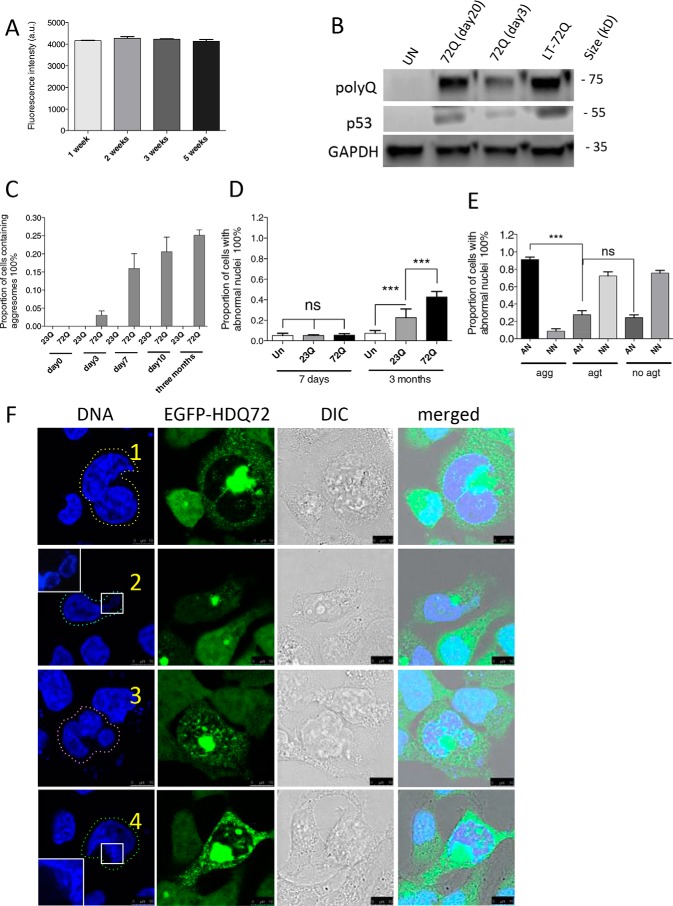
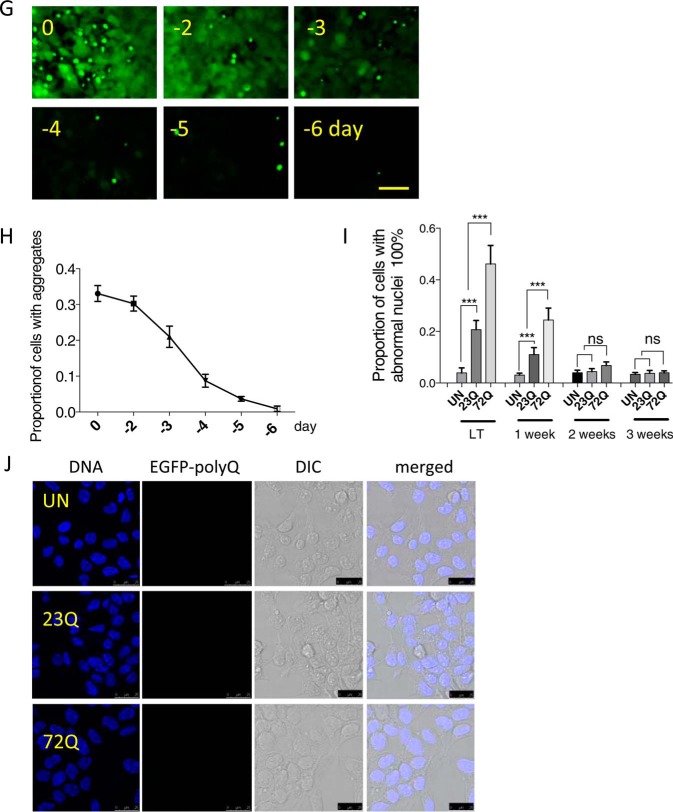
FIGURE 1.
Long term accumulation of aggresomes leads to abnormal nuclear morphology. A, cells expressed EGFP-HDQ72 consistently during long term expression as determined by flow cytometry, in which 10,000 cells were measured per independent cell population. The chart represents mean fluorescence ± S.D. of three independent cell populations. a.u., arbitrary units. B, immunoblotting of EGFP-HDQ72. Cells expressed EGFP-HDQ72 at the same level between day 20 and day 90 (long term). Un, uninduced cells. C, accumulation of juxtanuclear aggresomes in cells expressing EGFP-HDQ72 protein over a 3-month period. Cells expressing EGFP-HDQ23 did not form aggresomes. Four independent experiments were performed with ∼200 cells assessed per population per experiment (average of 4 sets of data: day 0, 0; day 3, 7 cells of 208 assessed; day 7, 34/213; day 10, 45/217; 3 months, 52/206). D, proportion of cells either induced (expressing EGFP-HDQ72 or EGFP-HDQ23 protein) or uninduced (negative control of the effects of protein expression) with abnormal nuclei at 7 days and 3 months. Three independent experiments were performed with ∼200 cells assessed per population per experiment. The chart represents the mean ± S.D. Samples were analyzed by binary logistic regression. ***, p < 0.001; ns, not significant. E, for cells expressing EGFP-HDQ72 for 3 months, >90% of cells containing aggresomes have abnormal nuclei. EGFP-HDQ72 cells without aggresomes have a similar proportion of abnormal nuclei as EGFP-HDQ23 cells. AN, abnormal nuclei; NN, normal nuclei; agg, aggresomes present; agt, cytosolic aggregates present (excluding aggresomes); no agt, neither aggresomes nor aggregates. Three independent experiments were performed with ∼200 cells assessed per population per experiment (average of three sets of data: AN (agg): 48/51 (of 51 aggresome-containing cells, 48 have abnormal nuclei); NN (agg): 3/51; AN (agt): 3/13; NN (agt): 10/13; AN (no agt): 41/149; NN (no agt): 108/149). The chart represents mean ± S.D. Samples were analyzed by binary logistic regression. ***, p < 0.001. F, confocal microscopy of abnormal nuclei in long term (3 months)-induced cells with aggresomes. Representative images of abnormal nuclei: 1, double nucleus (yellow dashed line, top row) (34/213: observed in 34 of 213 cells assessed); 2, fragmented nucleus (cyan dashed line, second row) (58/213); 3, compound abnormality (pink dashed line, third row) (29/213); and 4, damaged nucleus (green dashed line, fourth row) (119/213). As some abnormal nuclei have more than one type of abnormality, the sum of cells from all categories is larger than the total number of cells counted. Scale bars, 10 μm. G, wide-field microscopy showing that both soluble cytoplasmic EGFP-HDQ72 and insoluble aggresomes are gradually degraded after EGFP-HDQ72 expression is turned off. Long term (3 months)-induced cells expressing EGFP-HDQ72 represent samples before gene-switch-off (0 days), after which the medium was replaced with medium without inducer for 2, 3, 4, 5, and 6 days. Scale bar: 50 μm. H, proportion of cells with aggregates (both cytoplasmic aggregates and aggresomes) after expression of EGFP-HDQ72 was turned off. Long term induced cells were counted at different time points (2, 3, 4, 5, and 6 days) after the medium was replaced with medium without inducer. Three independent experiments were performed with ∼200 cells assessed per experiment. To limit the dilution effect of population growth, the proportion of cells with aggregates was normalized against the size of the cell population. I, proportion of cells with abnormal nuclei after expression of EGFP-HDQ72 was turned off. Long term-induced cells (LT) were counted at different time points (1, 2, and 3 weeks) after the medium was replaced with medium without inducer. Three independent experiments were performed with ∼200 cells assessed per population per experiment. The chart represents the mean ± S.D. Samples were analyzed by binary logistic regression. ***, p < 0.001; UN, uninduced EGFP-HDQ72 cells. J, confocal microscopy showing the nuclear morphology of uninduced EGFP-HDQ72 and induced EGFP-HDQ23 and EGFP-HDQ72 cells 3 weeks after EGFP-HDQ72 expression was turned off. Scale bar: 25 μm. DIC, differential interference contrast.


