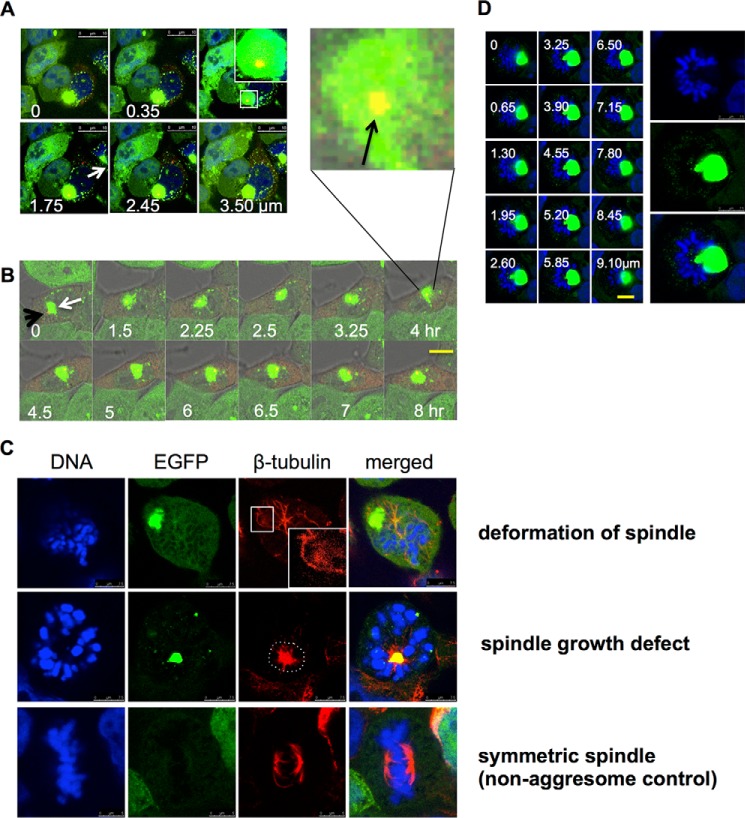
FIGURE 6.
Disruption of mitotic apparatus function by aggresomes. A, Z-stack imaging shows a centrosome trapped inside an aggresome. Long term-induced EGFP-HDQ72 cells transfected with a pericentrin-mCherry expression construct were fixed and analyzed by confocal microscopy. The white arrow indicates an aggresome, whereas the orange spot in the middle of aggresome is pericentrin. White font labels indicate the depth of each image. Scale bar, 10 μm. B, time-lapse experiments recorded the movement of a centrosome with an aggresome in a long term-induced EGFP-HDQ72 cell, which was transfected with a pericentrin-mCherry construct at 37 °C and 5% CO2. During the whole recording, pericentrin (orange spot) was accompanied by the aggresome (green cluster). The white arrow indicates the aggresome, whereas the black arrow indicates pericentrin (orange spot). Scale bar, 10 μm. C, representative confocal images show the interference of the aggresome with mitotic spindles and associated deformation (top row) (9/14: among 14 mitotic cells with aggresomes, 9 cells had this defect) and growth defects (middle row) of microtubules (5/14). Long term-induced EGFP-HDQ72 cells were fixed and stained for β-tubulin. Control cells (without an aggresome) have symmetric spindle microtubules (bottom row) (52/52). D, representative Z-stack images show an aggresome dominating the MTOC, with marked effects on the organization of the mitotic plate in 6 cells of 21 assessed. White font labels indicate the depth of each image. Scale bar, 5 μm.

