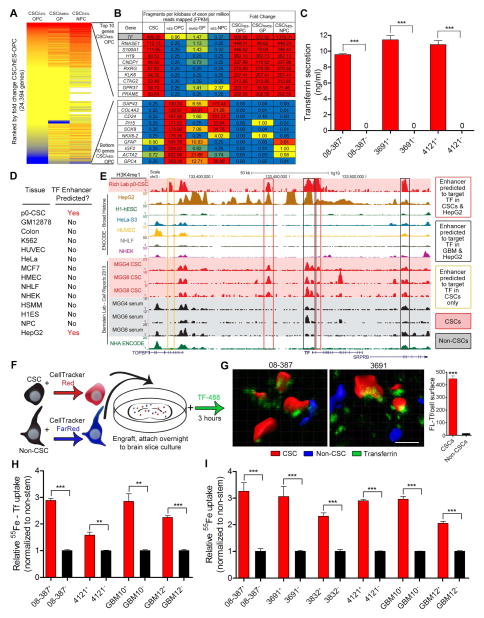
Figure 1.
Upregulation of TF through hepatocyte specific epigenetic program and increased iron uptake via TF in CSCs. (A) Heat map of fold change of gene expression (FPKM from RNA-seq) in CSCs versus normal neural progenitors. Red represents increased expression in CSCs compared to normal neural progenitor cells, while blue represents a decrease in expression in CSCs compared to normal controls. Samples compared are IN528 CSCs versus human Embryonic Stem (hES)-cell derived OPCs, Glial Progenitors (GP) derived from acute dissociated epilepsy resection, and hES-cell derived neuronal precursor cell (NPC). OPC and GP data was generated from this study while NPC data is from (Sauvageau et al., 2013). (B) Top and bottom 10 differentially expressed genes from cell types above (CSC FPKM/OPC FPKM). (C) TF secretion was measured in CSCs and non-CSCs using 1 μg protein from each xenograft specimen added to a transferrin ELISA (Abcam). ***, p < 0.001. (D) PreSTIGE analysis (Corradin et al., 2014) was conducted on H3K4me1 ChIP-seq data from CSCs and 13 ENCODE cell lines to determine enhancers predicted to target TF. (E) UCSC Browser image depicting H3K4me1 peaks at the TF locus. Red background designates acutely dissociated (p0) CSCs or in vitro (MGG) CSCs, black designates in vitro serum differentiated CSCs. Enhancers predicted by PreSTIGE to target TF in p0 CSCs. (F) Diagram of the experimental procedure for ex vivo imaging of TF uptake in brain slices. (G) Reconstructions of representative fields showing TF (green) in CSCs (red) and non-CSCs (blue) and quantification of fluorescent-Tf as measured on the surface of the three-dimensional reconstruction. ***, p = 4.73 × 10−166. Scale bar = 10 μm. (H) Radiolabeled iron (100 μM 55Fe bound to TF) uptake after 3 hr in CSCs compared to non-CSCs, **, p < 0.01; ***, p < 0.001. (I) Scavenge of iron (100 μM 55Fe) by CSCs and matched non-CSCs, ***, p < 0.001. Error bars represent ± SEM. See also Figure S1 and Table S1.

