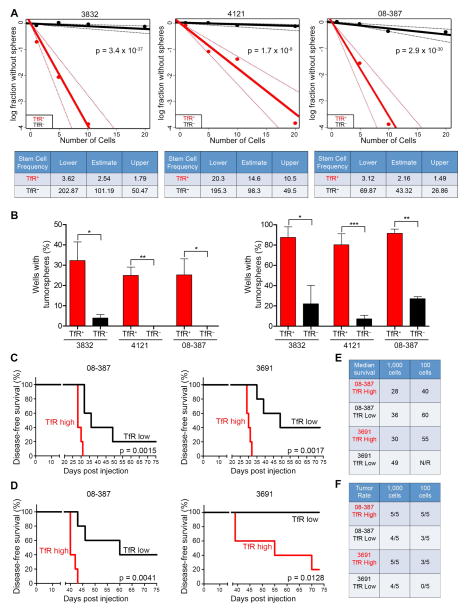
Figure 3.
TfR drives sphere formation in vitro and tumor formation in vivo. (A) In vitro limiting dilution assays plating decreasing numbers of FACS TfR+ or TfR− tumor cells from freshly dissociated GBM xenografts calculated with extreme limiting dilution assay (ELDA) analysis (Top). Stem cell frequencies from TfR+ and TfR− cells were calculated as the ratio 1/x, where 1 = stem cell and x = all cells (Bottom). (B) Percentage of wells that formed tumorspheres from either TfR+ or TfR− GBM cells based on plating 1 cell/well (Left) or 10 cells/well (Right). Error bars represent ± SEM. (C, D) Survival curves of mice orthotopically implanted with TfR-high or TfR-low expressing GBM cells at dilutions of 1,000 cells (C) or 100 cells (D); n = 5 for all groups. (E, F) Median survival (E, in days post injection) and tumor incidence (F, in days) in mice bearing GBM cells. See also Figure S3.

