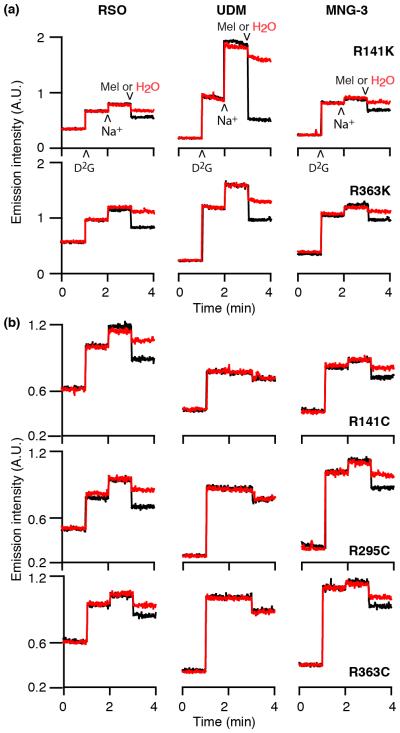
Fig. 2. Time trace of Trp→D2G FRET.
With excitation wavelength of 290 nm, emission was recorded at 465 nm for MelBEc or 490 nm for MelBSt. 10 μM D2G, 20 mM NaCl, melibiose (Mel, black) or water (red) were successively added at a 60-sec intervals. Left column, recorded with RSO vesicles; middle and right columns, recorded with RSO vesicles after solubilization with 1% UDM or 1% MNG-3, respectively. (a) R141K and R363K MelBSt mutants; (b) R141C, R295C, and R363C MelBSt mutants.

