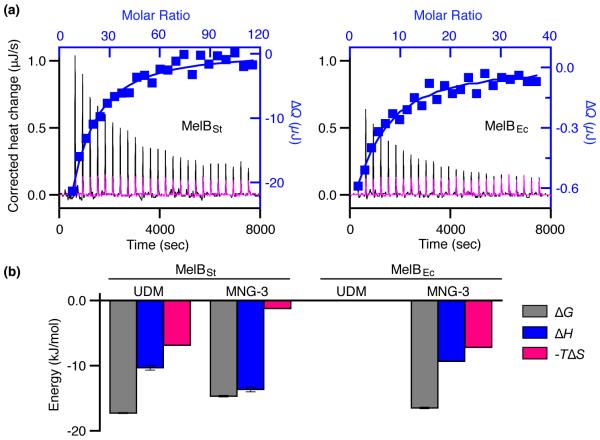
Fig. 4. Thermodynamics of melibiose binding with MelB in MNG-3.
WT MelBSt or MelBEc was solubilized with MNG-3 and purified in buffers containing 0.01% MNG-3. (a) Thermograms (with y-axis on the left side) were recorded at 25 °C during the titration of MelB (95 μM) with melibiose at 30 mM (MelBSt, black curve) or 10 mM (MelBEc, black curve). Injection of melibiose at 30 mM or 10 mM to the buffer in the absence of a protein is used for the control (magenta curves). ΔQ (with y-axis on the right side) was plotted against the melibiose/MelB molar ratio (on the top), and fitted to a one-site independent binding model. (b) Energetics of melibiose binding with MelB in UDM or MNG-3. Free energy change (ΔG), enthalpy change (ΔH), and entropy change (−TΔS) are obtained from curve fitting in Figs. 3 and 4 as described in the materials and methods. Errors, SEM, number of tests = 2 - 4.

