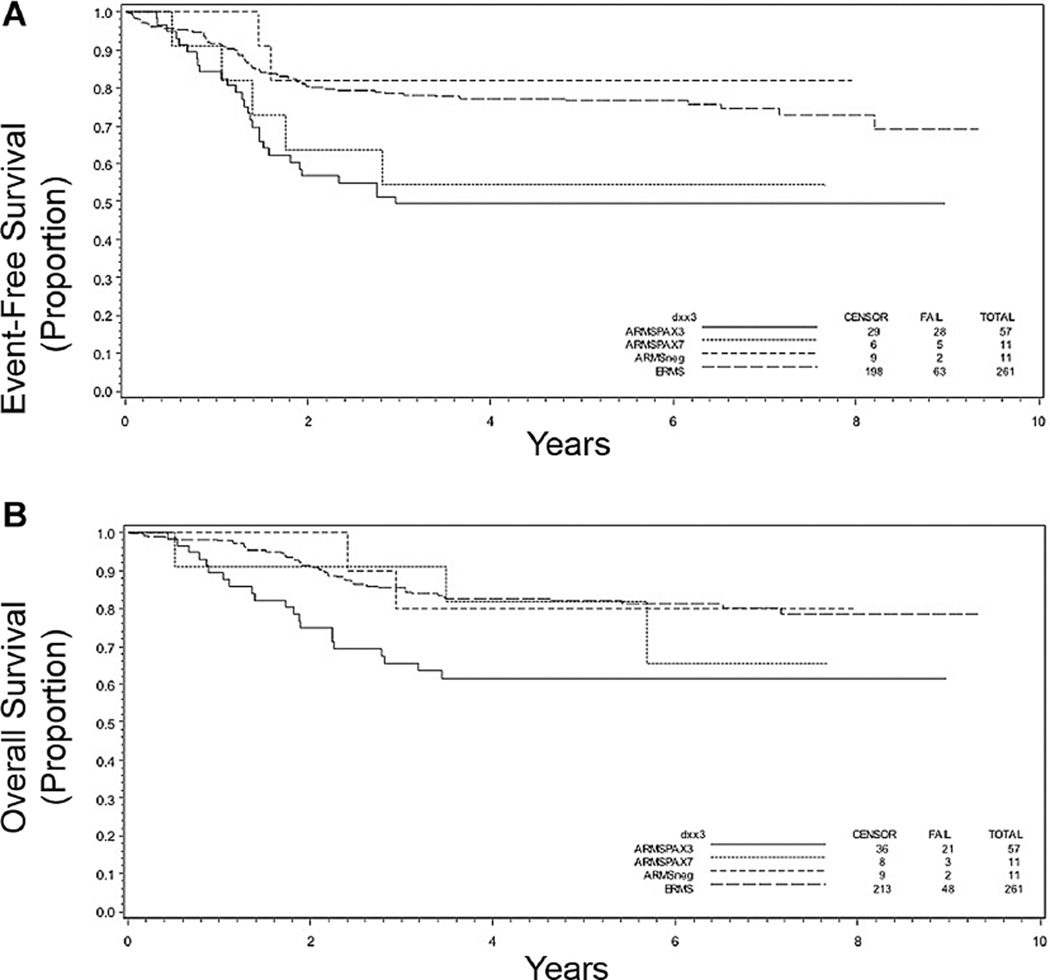
Fig. 5.
Kaplan–Meier curves depicting (A) event-free and (B) overall survival in years following diagnosis based on molecular classification of disease as being ERMS (n = 261), ARMSn (n = 11), ARMS PF3+ (n = 57), or ARMS PF7+ (n = 11) within the subset of patients with Stage 2, 3 and Group III disease. P < 0.001 (A) and 0.0054 (B).

