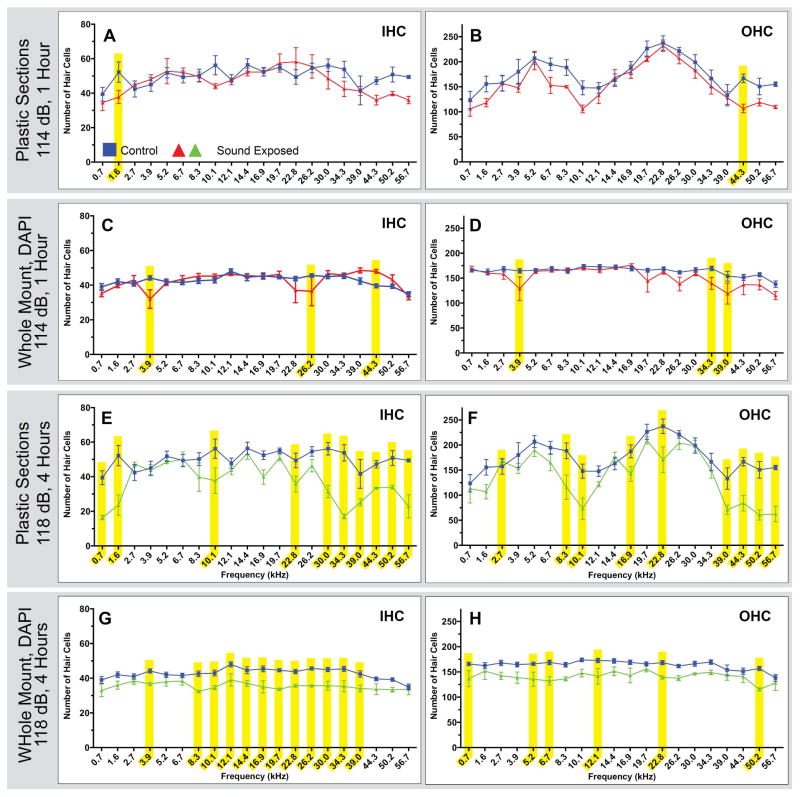
Figure 6. Comparisons of HC loss profiles as determined by both methods of tissue preparation.
Each point represents the mean number of HCs ± SEM for a given frequency range, and frequency ranges with statistically significant HC loss are highlighted in yellow (p<0.05 ). Significant hair cell loss resulting from exposure to a 114 dB, 16 kHz pure-tone for 1 hour is minimal as determined by either method of tissue preparation (panels A–B and C–D). Hair cell loss resulting from exposure to a 118 dB, 16 kHz pure-tone for 1 hour is more severe as determined by either method of tissue preparation (panels E–F and G–H). The HC counts derived from plastic sections (E–F) show more high frequency regions of HC loss and fewer mid frequency regions of HC loss than HC counts derived from whole mount dissected tissue (G–H).

