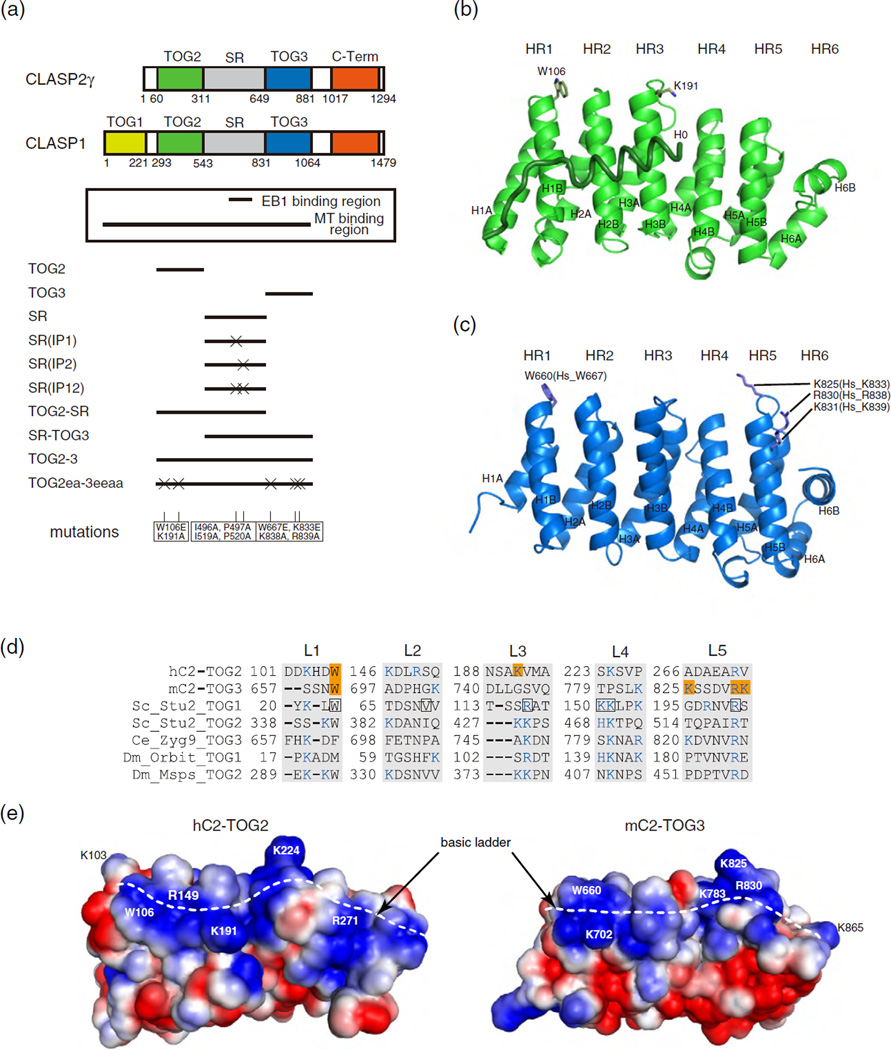
Fig. 1.
Crystal structure of the TOG domains from CLASP2. (a) Domain organization of CLASP1 and CLASP2γ. EB1- and MT-binding regions are shown in the box. Schematics of the constructs of human CLASP2 tested in this in vitro study are shown below the box. Mutations used in this study are listed at the bottom. (b and c) Cartoon representation of hC2-TOG2 (b) and mC2-TOG3 (c). The H0 helix of hC2-TOG2 is shown as a coil. The N-terminal helices of HRs are labeled “A” and the C-terminal helices are labeled “B”. Residues mutated in this study are shown in stick representation. In (c), mouse TOG3 residue numbers are labeled, and the corresponding numbers in human TOG3 are indicated in brackets. (d) Sequences of the tubulin-binding loops (L1-5) in TOG domains whose structures were determined previously: hC2-TOG2; mC2-TOG3; Saccharomyces cerevisiae (Sc) Stu2 TOG1 and TOG2; Caenorhabditis elegans (Ce) Zyg9 TOG3; Drosophila melanogaster (Dm) Orbit TOG1 and Msps TOG2. Residues mutated in this study are highlighted in orange. Basic residues forming a basic ladder are colored blue. The tubulin-binding residues seen in the Stu2-TOG1:tubulin complex are boxed in black. (e) Electrostatic potential of hC2-TOG2 (left) and mC2-TOG3 (right) countered from –1.5 kTe−1 (red) to +1.5 kTe−1 (blue), as calculated by APBS [52]. The orientation is the same as in (b) and (c). The H0 helix in hC2-TOG2 is not included. Residues discussed in the text are labeled. The basic ladders are indicated with white broken lines.

