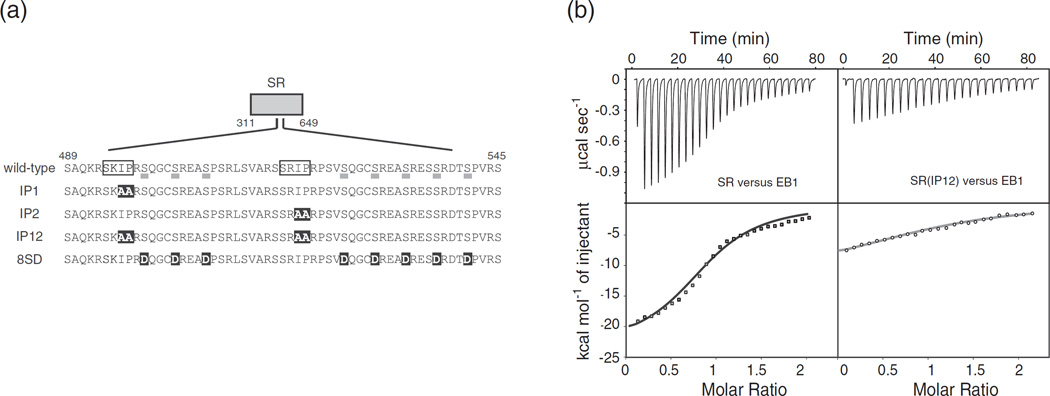
Fig. 7.
CLASP2 interacts with EB1. (a) EB1-binding region of CLASP2. Two SxIP motifs are boxed. The eight serine residues underlined are GSK3 phosphorylation sites [23]. IP1, IP2 and IP12 indicate the alanine-substitution mutations introduced in this study. 8SD indicates the phosphorylation mimicking mutations. Mutated residues are highlighted in black. (b) ITC data for titration of EB1 into SR and SR(IP12). (top) Raw data; (bottom) integrated heat changes, corrected for the heat of dilution, and the fitted curve based on a single-site binding model.

