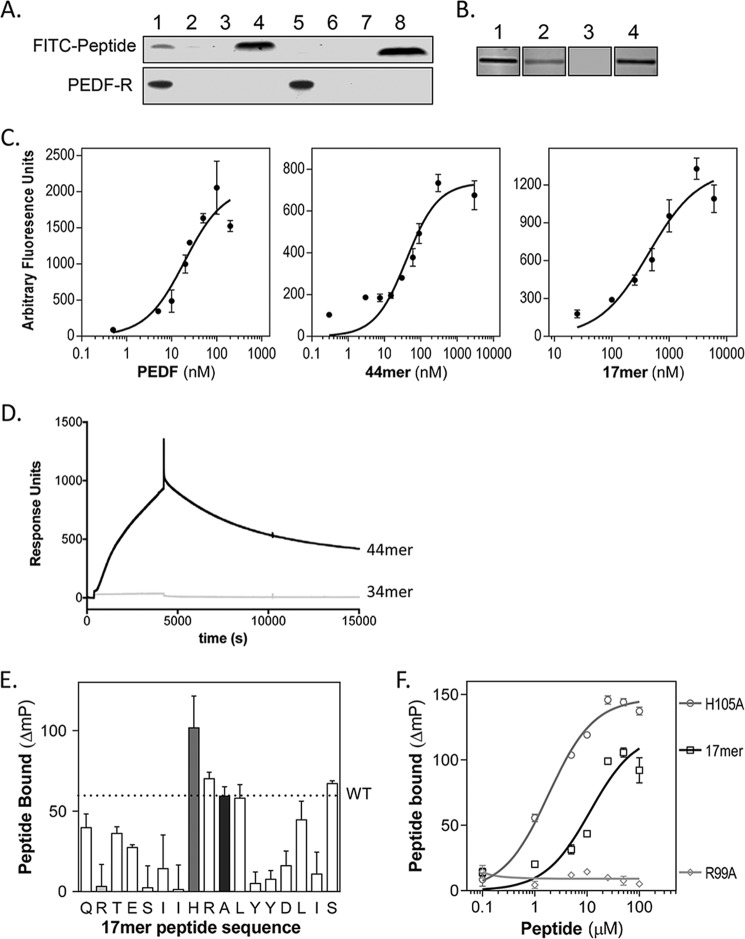
FIGURE 2.
PEDF 44-mer and 17-mer binding to PEDF-R. A, pulldown of FITC-labeled 44-mer and 34-mer peptides bound to recombinant His6/Xpress-tagged PEDF-R with Ni-NTA beads. The top and bottom blots show detection of FITC peptides by fluorescence imaging and PEDF-R detected by immunoreactivity with anti-Xpress, respectively. Lanes 1–4 correspond to 44-mer, and lanes 5–8 to 34-mer, with lanes 1 and 5 for FITC peptide with in vitro expressed His6/Xpress-PEDF-R, lanes 2 and 6 for FITC peptide with in vitro expression reaction without PEDF-R plasmid, and lanes 3 and 7 for FITC peptides incubated without in vitro expression reaction. Total amount of FITC peptides in each binding reaction was loaded in lanes 4 and 8. B, ligand blot of P1 peptide immobilized on nitrocellulose and incubated with solutions of fluorescently labeled ligands. Each condition was performed in triplicate, and a fluorescence image of one representative slice is shown. Concentration of ligands were as follows: lane 1, 50 nm Fl-PEDF; lane 2, 3 μm FITC-44-mer; lane 3, 3 μm FITC-34-mer; lane 4, 3 μm FITC-17-mer. C, saturation binding experiments performed from ligand blots. Concentrations of the fluorescently tagged ligands varied as indicated in the x axis. The y axis corresponds to estimated intensities of fluorescence in scanned ligand blots using ImageJ. Each data point is the average of triplicate assays ± standard error. The plots were fit in GraphPad Prism, and the estimated Kd values for PEDF, 44-mer, and 17-mer were 9.1 ± 1.1, 40.8 ± 5.9, and 412.6 ± 80.1 nm, respectively. D, real time binding to P1 peptide by SPR. Two surfaces were prepared without (reference) and with immobilized P1 peptide on CM5 sensor chips via amine-coupling chemistry. During binding analysis, the P1 chip was paired with a reference chip. The binding of 34-mer or 44-mer peptide (injections of 300 μl at 5 μm) in TBS50-T at a flow rate of 5 ml/min was measured (response units). Subsequently, the chips were washed with TBS50-T, and peptide dissociation was followed for 3 h at 5 ml/min. Sensograms are shown. E and F, alanine scan of 17-mer and binding to peptide P1. E, fluorescence polarization mixtures of each peptide at 10 μm and FITC-P1 peptide at 20 pm. The plot shows the change in FITC-P1 peptide polarization due to 17-mer binding for each peptide. The letters on the x axis show the amino acid in the 17-mer peptide substituted for an alanine in single letter code ordered as in the sequence. The A in the tenth position is for WT 17-mer peptide. Each bar corresponds to binding of each peptide of the alanine scan set. The gray, light gray, and black bars correspond to the WT 17-mer, 17-mer[R99A], and 17-mer[H105A], respectively. F, binding curves of 17-mer peptides. The plot shows the change in FITC-P1 peptide polarization when titrated with peptides 17-mer, 17-mer[H105A], and 17-mer[R99A] at concentrations as indicated with 20 pm FITC-P1. Each point is the average ± standard error of triplicate assays for each condition. The plots were fit in GraphPad Prism, and the estimated half-maximum polarization change (EC50) values were 11.42 ± 3.16 μm for 17-mer[H105A] and 1.83 ± 0.197 μm for 17-mer.

