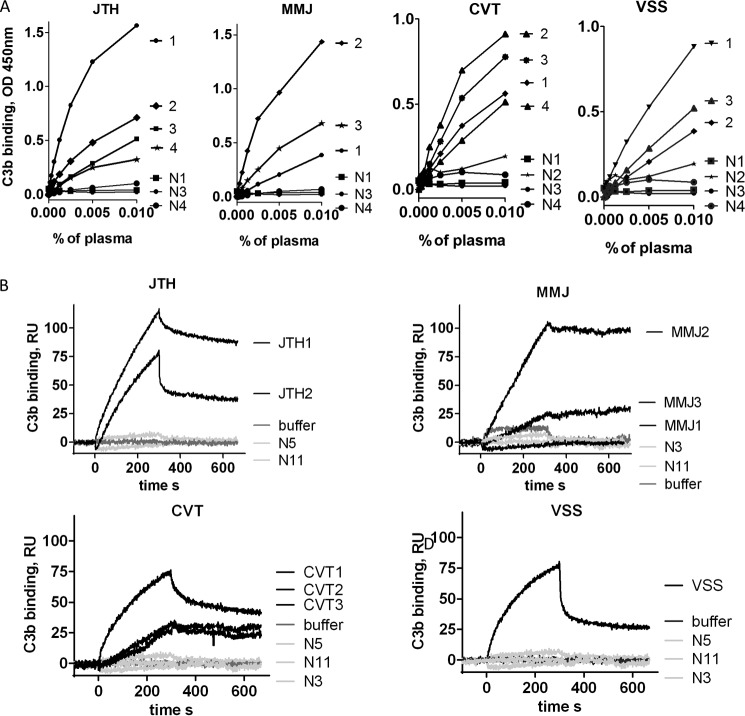
FIGURE 3.
Binding of anti-C3 antibodies to C3 and C3b. A, dose dependences of the binding of IgG from different follow up plasma samples to immobilized C3, measured by ELISA. B, binding of purified IgG from the highest positive samples to C3b in real time, measured by SPR. N, normal control IgG, purified from healthy donors. N1, N2, N3, and N4 indicate the number of available consecutive samples from the given patient. The percentage of plasma reflects the sample dilution.

