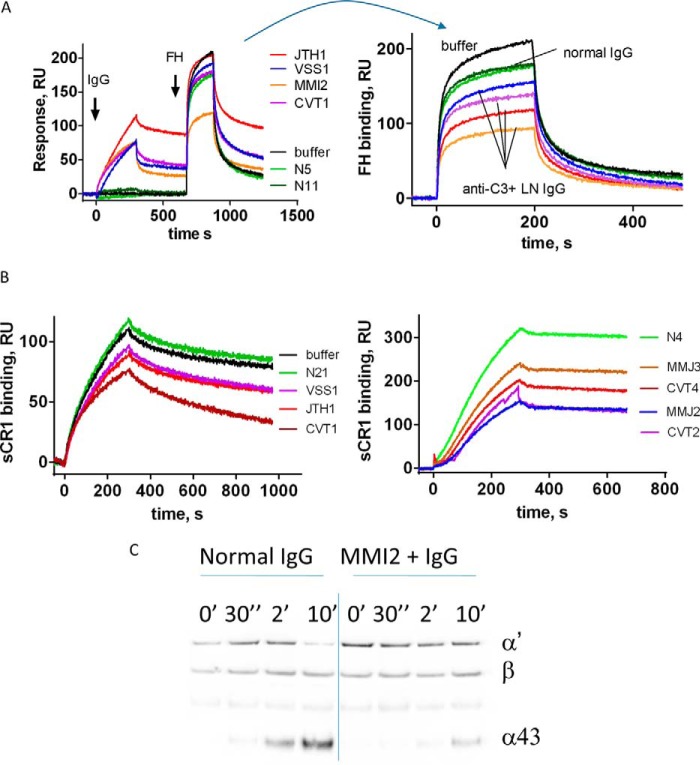
FIGURE 5.
Functional consequences of the anti-C3 antibodies. Shown is binding of Factor H (A) and binding of soluble CR1 (B) to a C3b-coated SPR chip, exposed to IgG from healthy donors, IgG from LN patients, or buffer only, measured by SPR. Black line, buffer control; green line, healthy donor IgG. Results from two independent experiments with different samples are presented for CR1. A, left, phase of the interaction of IgG with the immobilized C3b is depicted, followed by the introduction of FH. Right, phase of introduction of FH, where the curves are aligned at the moment of FH injection. C, evaluation of the cofactor activity of FH in the presence of IgG from healthy donor and from an anti-C3 autoantibody-positive patient. C3b, FH, FI, and IgG were incubated for the indicated times. The reaction was stopped by the addition of reducing sample buffer, and the cleavage pattern of C3b was evaluated by a Western blot. The appearance of the α43 band (an indicator for the cleavage of C3b to iC3b by FI) was measured over time. The results for MMJ are shown. Purified IgG from the plasma of the patients JTH, MMJ, CVT, and VSS was used for this study.

