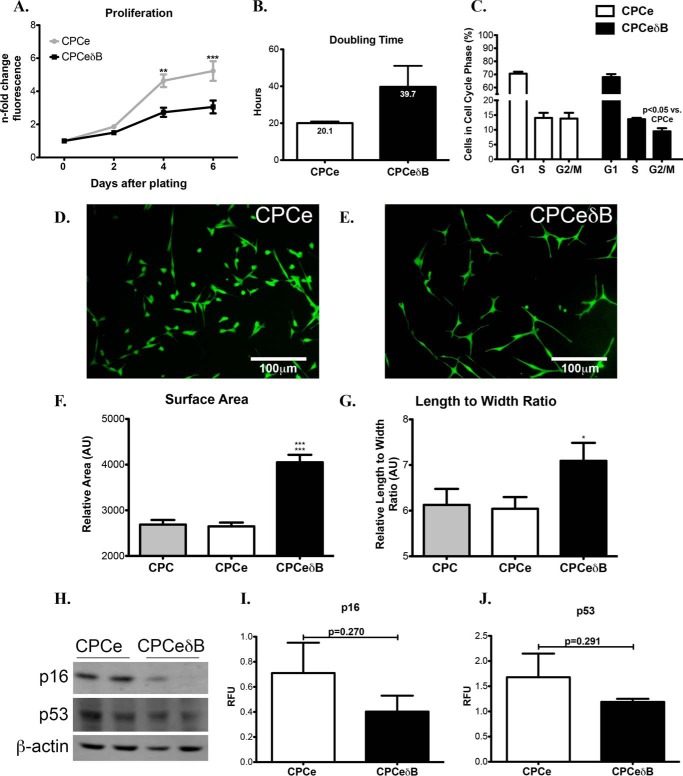
FIGURE 4.
Nuclear CaMKIIδ overexpression in CPCs promotes increases in cellular size and decreased proliferation. A, CPCeδB has decreased proliferative capacity relative to CPCe based on a fluorescent nucleic acid stain measured at 2, 4, and 6 days after seeding equal cell numbers. ** and *** p < 0.01 and p < 0.0001 CPCeδB relative to CPCe. B, CPCeδB populations shows an increased doubling time relative to CPCe. C, cell cycle analysis using flow cytometry in CPCe and CPCeδB. D, fluorescent images of CPCe and E, CPCeδB populations in growth media. F, CPCeδB shows an increase in relative cell surface area. ***, p < 0.0001 CPCeδB relative to CPC and CPCe. G, CPCeδB shows an increase in length to width ratio relative to non-modified CPCs and CPCe. *, p < 0.01 CPCeδB relative to CPCe. H, expression of senescence markers p16 and p53 by immunoblot. β-Actin was probed as a loading control. I, quantitation of p16 and J, p53 in CPCe and CPCeδB populations.

