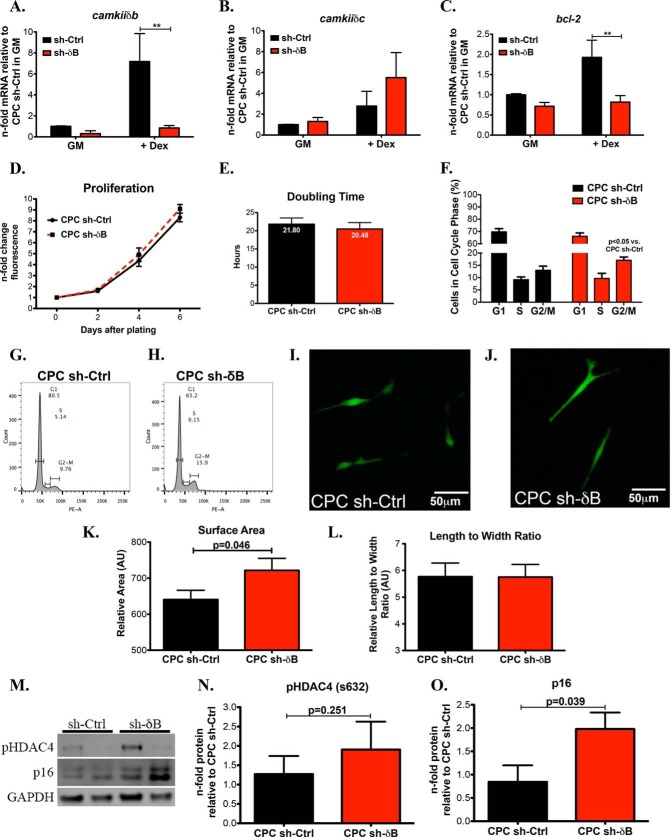
FIGURE 9.
Knockdown of CaMKIIδB in CPCs prevents the up-regulation of pro-apoptotic molecules and promotes properties of cellular senescence. A, CaMKIIδB; B, CaMKIIδC; and C, Bcl-2 gene expression in CPC sh-Ctrl and CPC sh-δB during growth conditions or with the addition of dex. Values are represented as n-fold mRNA relative to CPC sh-Ctrl in GM and after normalization to ribosomal 18S. **, p < 0.01. D, proliferation measured using a direct nucleic acid fluorescent dye. Fluorescent values are represented as a fold change relative to day of plating (Day 0). E, cell doubling time in hours. F, cell cycle analysis using propidium iodide to determine percentage of cells in the different stages of the cell cycle analyzed by flow cytometry. G, cell cycle images of CPC sh-Ctrl and H. CPC sh-δB. I, fluorescent images of CPC sh-Ctrl; and J, CPC sh-δB. K, CPC sh-Ctrl and CPC sh-δB cell surface area and L, length to width ratio represented as arbitrary units. M, immunoblot representation of pHDAC4 on the serine 632 and p16. N, quantitation of pHDAC4 and O. Senescence marker p16. Values are represented as a fold change relative to CPC sh-Ctrl and after normalizing to GAPDH.

