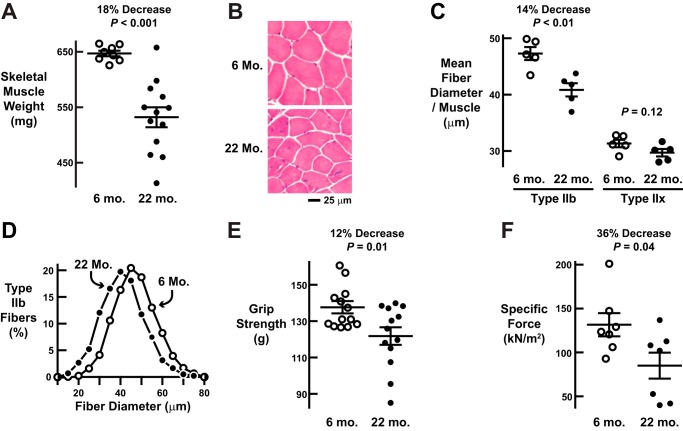
FIGURE 1.
Mouse model of age-related skeletal muscle weakness and atrophy. A–F, we compared weight-matched cohorts of mature adult (6-month (mo.)) and old (22-month) male C57BL/6 mice. A, combined weight of bilateral quadriceps femoris and triceps brachii muscles. Each data point represents one mouse, and horizontal bars denote means ± S.E. B, representative H&E images of quadriceps cross-sections. C, average diameters of type IIb and IIx fibers in the quadriceps. Each data point represents the mean of ≥800 type IIb fibers or ≥100 type IIx fibers from one mouse, and horizontal bars denote average of the means ± S.E. D, size distribution of all type IIb fibers from C. E, in vivo forelimb grip strength. Each data point represents the mean of five measurements from one mouse, and horizontal bars denote the average of the means ± S.E. F, ex vivo specific tetanic force generated by the extensor digitorum longus muscle. Each data point represents one mouse, and horizontal bars denote means ± S.E. In A, C, E, and F, p values were determined with t tests. kN, kilonewtons.

