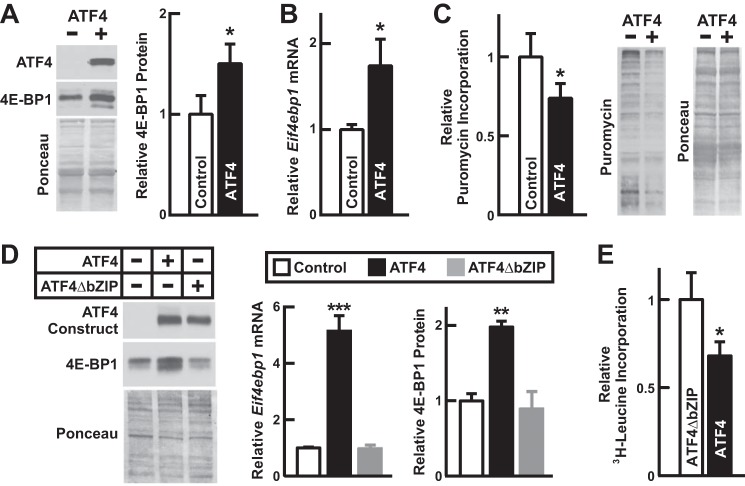
FIGURE 7.
ATF4 reduces skeletal muscle protein synthesis. A–C, we used 2-month-old male C57BL/6 mice and transfected one tibialis anterior muscle with 20 μg of empty plasmid (pcDNA3; control) and the contralateral tibialis anterior with 20 μg of pcDNA3 encoding FLAG-tagged ATF4 (p-ATF4-FLAG). A and B, bilateral tibialis anterior muscles were harvested 3 days post-transfection. A, tibialis anterior protein extracts were subjected to immunoblot analysis using anti-FLAG and anti-4E-BP1 antibodies. Left, representative immunoblots and Ponceau S stains. Right, quantification of 4E-BP1. Data are means ± S.E. from nine mice. B, qPCR analysis of Eif4ebp1 mRNA. Data are means ± S.E. from four mice. C, skeletal muscle protein synthesis was assessed by administering intraperitoneal injections of puromycin 3 days post-transfection, harvesting bilateral tibialis anterior muscles 30 min later, and then subjecting tibialis anterior protein extracts to immunoblot analysis with an anti-puromycin antibody. Left, quantification of incorporated puromycin. Data are means ± S.E. from five mice. Right, representative immunoblot and Ponceau S stain. D, fully differentiated C2C12 myotubes were infected for 48 h with recombinant adenoviruses expressing GFP alone (control), GFP plus FLAG-tagged ATF4, or GFP plus a full-length, transcriptionally inactive FLAG-tagged ATF4 construct (ATF4ΔbZIP). Left, representative anti-FLAG and anti-4E-BP1 immunoblots and Ponceau S stains. Middle, qPCR analysis of Eif4ebp1 mRNA. Data are means ± S.E. from six replicates/condition. Right, quantification of 4E-BP1. Data are means ± S.E. from four replicates/condition. E, myotube protein synthesis was assessed by infecting C2C12 myotubes for 48 h with recombinant adenoviruses expressing GFP plus ATF4ΔbZIP or GFP plus FLAG-tagged ATF4 and then measuring [3H]leucine incorporation into total cellular protein. Data are means ± S.E. from five experiments. In A–E, p values were determined with t tests (A–C and E) or a one-way ANOVA with Dunnett's multiple comparison test (D). *, p < 0.05; **, p < 0.01; ***, p < 0.001. Error bars denote means ± S.E.

