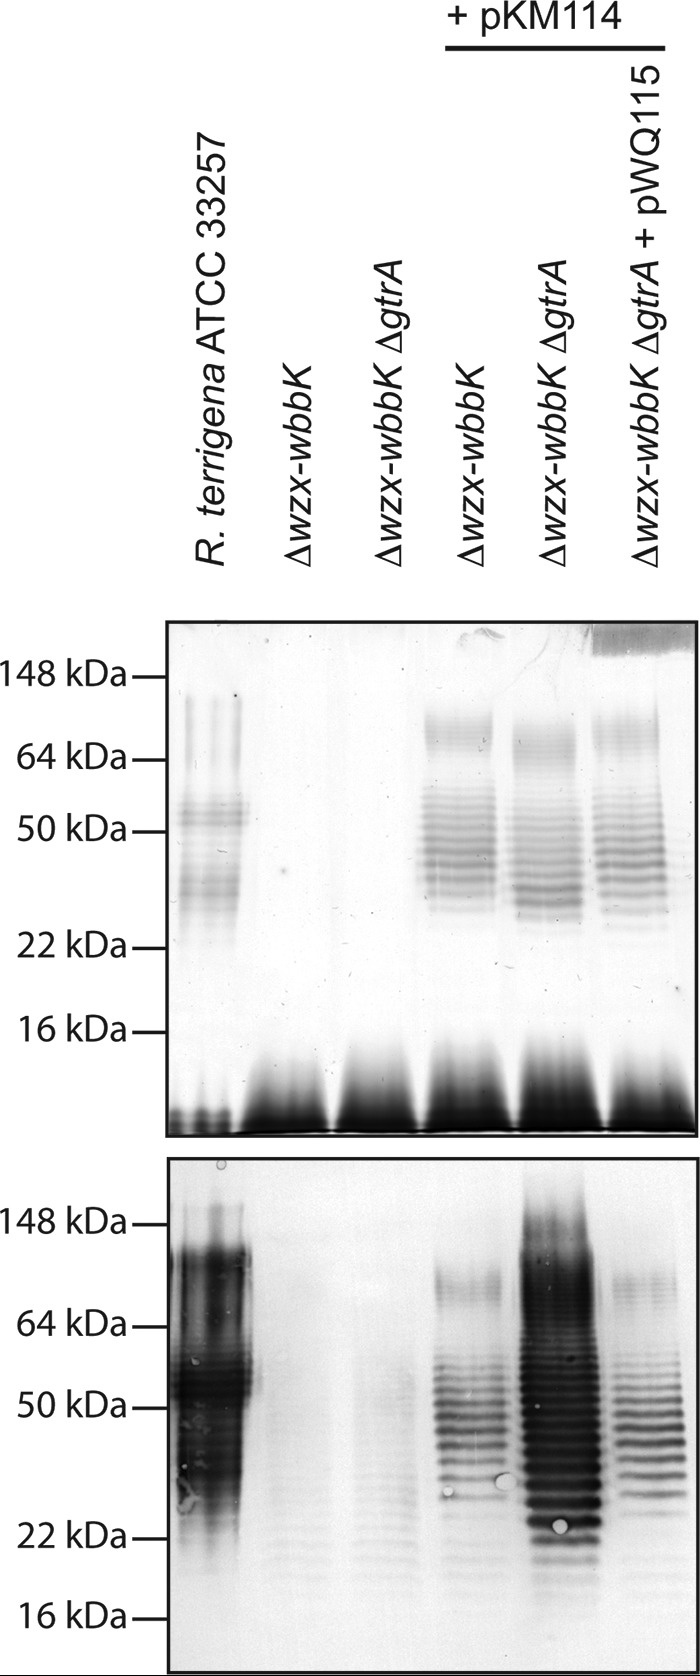
FIGURE 3.

Reaction of LPS from R. terrigena ATCC 33257 and E. coli recombinant strains with antibodies raised against the K. pneumoniae O12 antigen. The figure shows the silver-stained SDS-PAGE LPS profile (upper panel) and the corresponding immunoblot (lower panel). The samples were proteinase K-treated whole cell lysates. The markers indicated on the left are protein standards to allow comparison of LPS migrations in different backgrounds.
