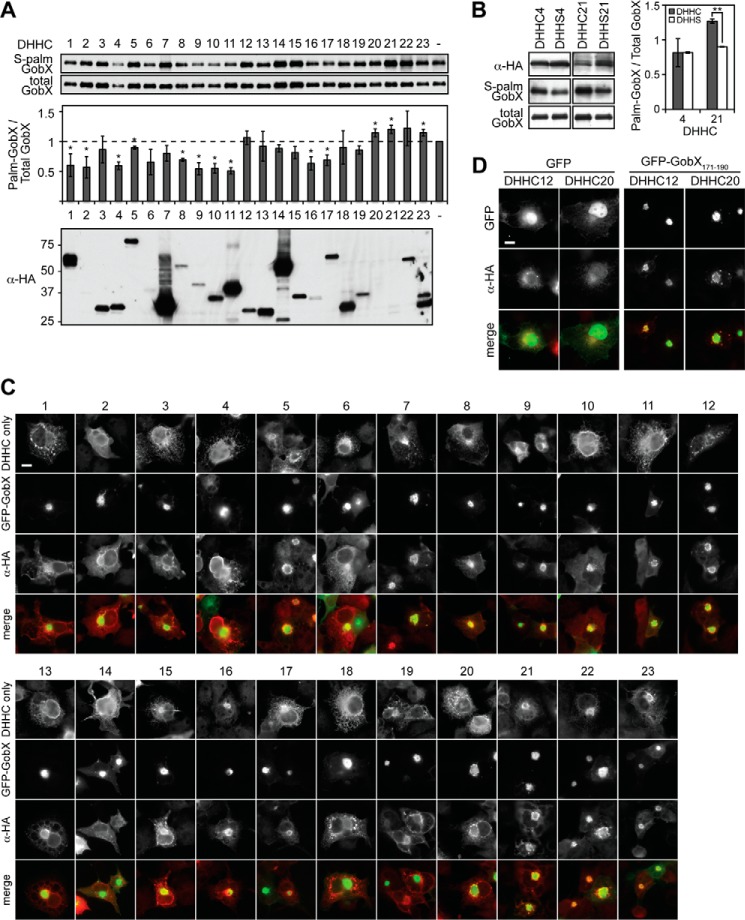
FIGURE 6.
GobX palmitoylation requires the activity of host DHHC palmitoyltransferases. A, GobX palmitoylation is altered by multiple DHHC proteins. HEK293T cells were co-transfected with plasmids encoding GFP-GobX and each of the 23 mouse DHHC palmitoyltransferases. Cells were metabolically labeled with 17-ODYA for 30 min. GFP-GobX was immunoprecipitated, click-labeled with biotin-azide, and subjected to immunoblot analyses as described in Fig. 5B. The signal of S-palmitoylated and total GobX in cells singly transfected with GFP-GobX (−) were set as 1 in both immunoblots, and the signal of the DHHC co-transfected cells were normalized relative to it. The ratio of S-palmitoylated GobX over total GobX is plotted in the graph, and the average was taken from two independent experiments. (Statistical analysis was performed using a two-tailed Student t test. *, p < 0.1 relative to GFP-GobX single transfected cells.) Production of the 23 mouse DHHC palmitoyltransferases in the HEK293T cell lysate was determined by immunoblot using anti-HA antibody. B, catalytically inactive PATs do not enhance GobX palmitoylation. HEK293T cells were co-transfected with plasmids encoding GFP-GobX and the indicated DHHC palmitoyltransferases in their active (DHHC) or inactive (DHHS) form. 17-ODYA labeling and detection was performed as in A. The average was taken from two independent experiments. (Statistical analysis was performed using a two-tailed Student t test. **, p < 0.01.) The presence of DHHC or DHHS palmitoyltransferases in HEK293T cell lysate was determined by immunoblot using anti-HA antibody. C, GobX recruits DHHC proteins to the Golgi region. The subcellular localization of the 23 DHHC proteins in the absence (top panel) or presence (bottom panels) of GobX was visualized in transiently transfected COS-1 cells. Scale bar, 2 μm. D, GobX(171–190) recruits DHHC palmitoyltransferases to the Golgi. The subcellular localization of DHHC 12 and 20 was visualized in COS-1 cells co-transfected with GFP or GFP-GobX(171–190). Scale bar, 2 μm. All immunofluorescence images are representatives of at least two independent experiments with similar outcomes.

