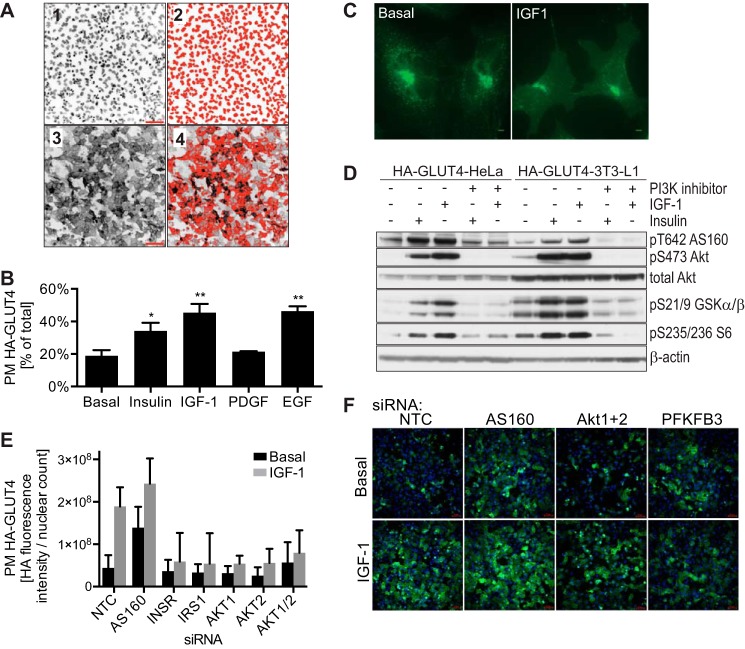
FIGURE 1.
Establishment of siRNA screen in HA-GLUT4-HeLa cells. A, HA-GLUT4-HeLa cells were subject to IGF-1-stimulated HA-GLUT4 translocation assay and images taken at ×20 magnification using an IN Cell Analyzer detecting nuclei (1) or surface GLUT4 (3). Images were analyzed using IN Cell developer toolbox 1.8 software. Object segmentation and post-processing including binary sieving and erosion was applied to identify and count the nuclei (2) from the unprocessed image (1). To quantify surface GLUT4, intensity segmentation was applied to exclude background fluorescence and post-processing (binary sieving) was applied to measure the fluorescence intensity and the area (4). Surface GLUT4 (fluorescence intensity × area) was divided by number of nuclei for normalization. B, HA-GLUT4-HeLa cells were serum starved for 2 h before treatment with or without 200 nm insulin, 100 ng/ml of IGF-1, 100 ng/ml of PDGF, or 100 ng/ml of EGF for 15 min. GLUT4 translocation to the PM was determined by surface HA-GLUT4 staining normalized to total HA-GLUT4, n = 4, standard deviation is shown, *, p < 0.001; **, p < 0.0001 versus basal. C, immunofluorescence of HA-GLUT4 in HA-GLUT4-HeLa cells in the presence or absence of 100 ng/ml of IGF-1 for 15 min was performed. Scale bar is 5 μm. D, HA-GLUT4-HeLa cells and HA-GLUT4–3T3-L1 adipocytes were serum-starved for 2 h, followed by incubation with or without 100 nm PI3K inhibitor wortmannin, and stimulation with or without 200 nm insulin or 100 ng/ml of IGF-1 for 15 min. Cell lysates were immunoblotted with the indicated antibodies (loading control: β-actin). E and F, validation of the siRNA screen in HA-GLUT4-HeLa cells with siRNAs against components of the insulin signaling pathway, including insulin receptor (INSR), AS160, IRS1, Akt1, Akt2, Akt1 + 2, and non-targeting control (NTC). 72 h after siRNA transfection, cells were serum starved, stimulated with or without 100 ng/ml of IGF-1 for 15 min, followed by HA-GLUT4 translocation assay and image analysis. Mean ± S.D. of raw values of 2 replicates (E) and representative images taken by IN Cell Analyzer (F) are shown. Scale bar is 70 μm.

