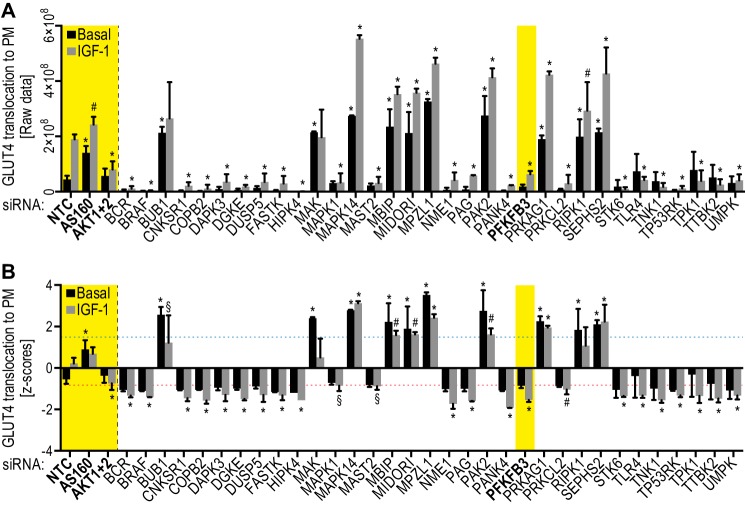
FIGURE 4.
siRNA screen identifies 23 positive and 10 negative kinases. HA-GLUT4-HeLa cells were transfected with the indicated siRNAs and GLUT4 translocation to the PM was determined as described under “Experimental Procedures.” Raw values (fluorescence intensities/nuclei counts) (A) and Z-scores (B) of basal and IGF-1-stimulated GLUT4 translocation to the PM are shown. Mean ± S.D. of n = 2 for kinases and n = 10 for controls are shown. Controls (NTC, AS160, and Akt1 + 2) and PFKFB3 are indicated in bold and yellow. Dotted lines (in B) indicate Z-score cut-offs for the secondary screen, Z-score basal ≥1.6 for negative kinases (blue dotted line) and Z-score stimulated ≤ −0.8 for positive kinases (red dotted line). *, p < 0.0001; #, p < 0.01; §, p < 0.05 versus NTC.

