
FIGURE 5.
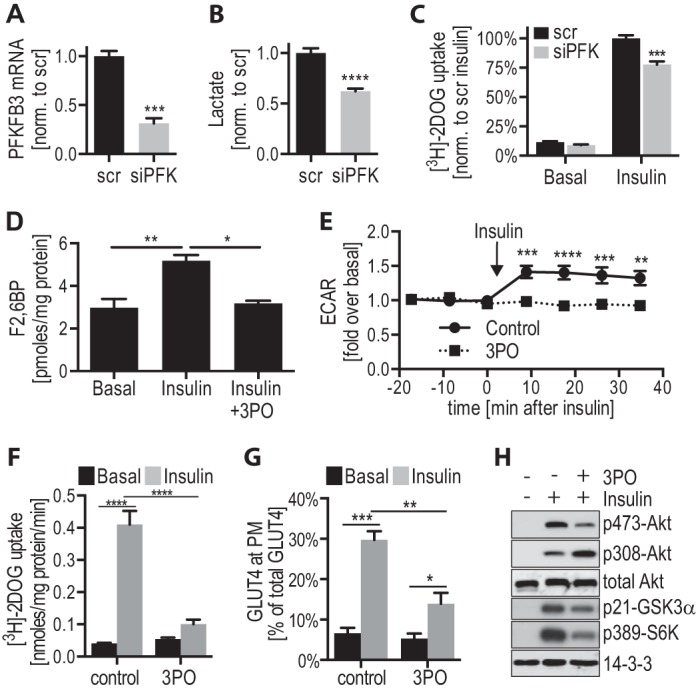
Inhibition of PFKFB3 activity inhibits insulin action in 3T3-L1 adipocytes. A–C, 3T3-L1 adipocytes were transfected with scrambled (scr) siRNA or PFKFB3 siRNA (siPFK) 96 h prior to experiments. A, cell medium that was incubated on the cells for 16 h was collected and lactate levels were measured and normalized to Scr control (n = 11). B, mRNA was isolated from Scr- and siPFK-transfected adipocytes, quantitative PCR was performed for PFKFB3 and normalized to cyclophilin control (n = 3). C, Scr- and siPFK-transfected 3T3-L1 adipocytes were incubated in serum-free medium, followed by insulin (100 nm) stimulation. Glucose uptake was measured using [3H]2-deoxyglucose ([3H]-2DOG) (n = 3). D–F, 3T3-L1 adipocytes were incubated in serum-free medium for 1.5 h, followed by incubation with 100 μm 3-PO or dimethyl sulfoxide control for 30 min, prior to stimulation with or without 100 nm insulin for 20 min (or indicated time). D, Fru-2,6-BP (F2,6BP) was measured in 3T3-L1 adipocytes ± 3-PO. Mean ± S.D. of n = 2 is shown. E, extracellular acidification rate (ECAR) was measured during insulin stimulation ±3-PO using a Seahorse Bioanalyser (n = 3). F, insulin-stimulated glucose uptake ± 3-PO was measured using [3H]-2DOG (n = 5). G, insulin-stimulated HA-GLUT4 translocation to the PM ± 3-PO was determined in HA-GLUT4 expressing 3T3-L1 adipocytes (n = 7). H, insulin-stimulated phosphorylation of components of the insulin signaling pathway ± 3-PO was determined by immunoblotting cell lysates with the indicated antibodies (loading control: 14-3-3) and representative immunoblots are shown (n = 3). *, p < 0.05; **, p < 0.01; ***, p < 0.001; ****, p < 0.0001, error bars represent S.E. (except D).