FIGURE 8.
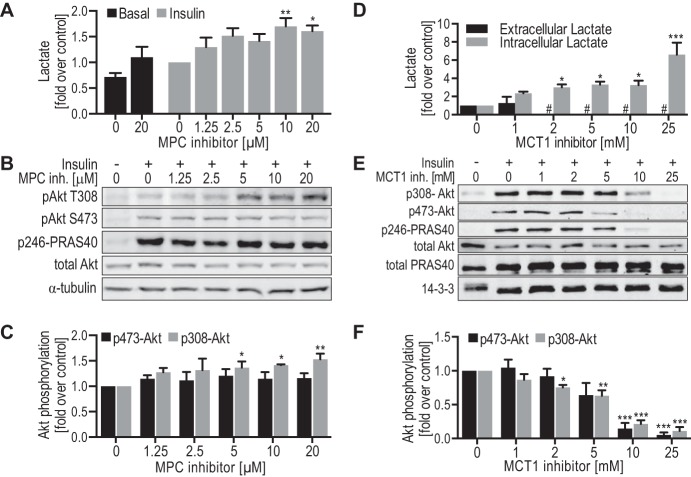
Modulation of aerobic glycolysis affects insulin signaling in 3T3-L1 adipocytes. A-C, 3T3-L1 adipocytes were treated with the indicated doses of MPC inhibitor UK-5099 in serum-free medium for 2 h, prior to stimulation with or without 10 nm insulin for 20 min. A, lactate was measured in the medium that was collected after stimulation with insulin, normalized to protein levels in each experiment, and normalized to insulin-stimulated control cells between experiments (n = 3 (basal) to 5 (insulin)). B, cell lysates were immunoblotted with the indicated antibodies (loading control: α-tubulin) and representative immunoblots are shown. C, quantification of insulin-stimulated Akt phosphorylation (data in B) is shown (phospho/total), normalized to insulin-stimulated control cells (n = 4–5). D–F, 3T3-L1 adipocytes were treated with the indicated doses of MCT1 inhibitor α-cyano-4-hydroxycinnamate in serum-free medium for 2 h, prior to stimulation with or without 10 nm insulin for 20 min. D, extracellular and intracellular lactate was measured in the medium or cells, respectively, after stimulation with insulin, normalized to insulin-stimulated control cells between experiments (n = 3–4). #, indicates not detected. E, cell lysates were immunoblotted with the indicated antibodies (loading control: 14-3-3) and representative immunoblots are shown. F, quantification of insulin-stimulated Akt phosphorylation (data in E) is shown (phospho/total), normalized to insulin-stimulated control cells (n = 5). *, p < 0.05; **, p < 0.01; ***, p < 0.0001 versus insulin-stimulated control cells, error bars represent S.E.

