FIGURE 7.
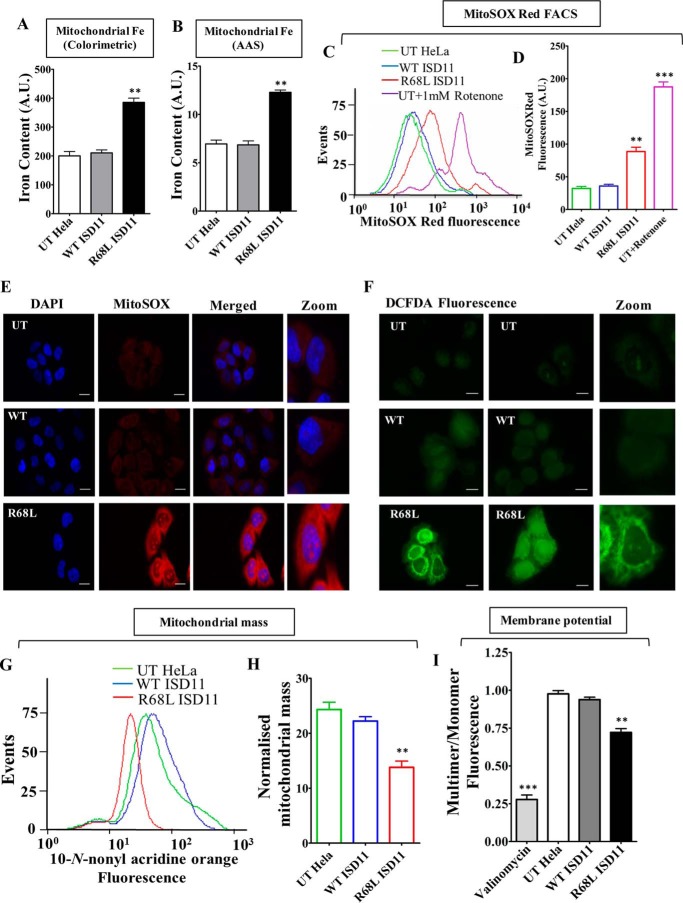
Estimation of mitochondrial iron content, ROS levels, and evaluation of mitochondrial functionality in R68L ISD11 mutant. A and B, mitochondrial iron level was estimated in untranslated (UT), WT, and R68L HeLa cells using iron specific colorimetric assay (A) and AAS (B). C, flow cytometry analysis to measure the mitochondrial superoxide level in HeLa cells using MitoSOX Red staining. D, representation of mean fluorescence intensity of MitoSOX Red fluorescence in UT, WT, and R68L HeLa cells. The UT cells treated with 1 mm rotenone were used as a positive control. E, untransfected HeLa cells (UT) or cells expressing WT or R68L mutant proteins were stained with MitoSOX Red dye. The fluorescence was analyzed using Zeiss Apotome fluorescence microscope using ×63 objective lens (scale bar: 10 μm). F, to measure the overall cellular ROS level, fluorescence images of HeLa cells stained with H2DCFDA dye (green fluorescence) were obtained from Zeiss Apotome fluorescence microscope using ×63 objective lens (scale bar: 10 μm). G and H, mitochondrial mass was estimated by staining HeLa cells with NAO dye. The total MFI values obtained from flow cytometric analyses of NAO staining are presented as histogram (G) and mean fluorescence values obtained in the flow cytometry were quantitated (H). I, mitochondria isolated from HeLa cells was stained with the JC-1 dye to measure the mitochondrial membrane potential. The emission spectrum was scanned from wavelength 500 to 620 nm, and the ratio between JC-1 multimer (590 nm) and JC-1 monomer (530 nm) was represented. Data are represented as mean ± S.E. The values were obtained from three independent experiments (n = 3). p value of <0.05 was defined as significant, and asterisks are used to denote significance, where: *, p < 0.05; **, p < 0.01; ***, p < 0.001. A.U., arbitrary unit.

