FIGURE 10.
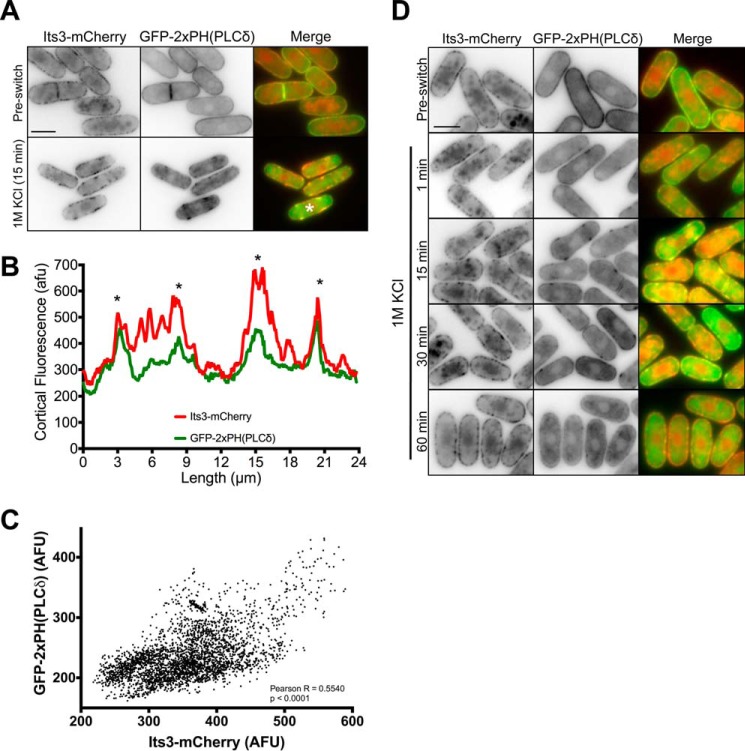
PI(4,5)P2 clusters contain the PI5K, Its3. A, co-localization of Its3-mCherry and GFP-2xPH(PLCδ) before and after 15 min of osmotic stress. Images are inverted single focal planes. B, line scan of Its3-mCherry and GFP-2xPH(PLCδ) signal from cell marked with a white asterisk in panel A. A line was drawn around the cell perimeter, and the fluorescence intensity was measured. Overlapping peaks that represent colocalized clusters are marked with asterisks. afu, arbitrary fluorescent units. C, Scatterplot of Its3-mCherry and GFP-PH(PLCδ) signal for each pixel at the cortex of 10 individual cells after 15 min of osmotic stress. In each cell a line was drawn around the cell perimeter, and the fluorescence was measured in both channels for each pixel. D, timing of Its3-mCherry and GFP-2xPH(PLCδ) clusters during osmotic stress. Note co-localized clusters within 1 min. Images are inverted single focal planes. All scale bars are 5 μm.

